Technique
- Place patient comfortably supine
- Position neck to best expose the swelling*
- Apply lots of gel for comfort if the area is tender (7)
- Consider pre-procedural analgesia
- Using the linear transducer, scan the area of interest in the longitudinal plane
- Scan the area of interest in the transverse plane.
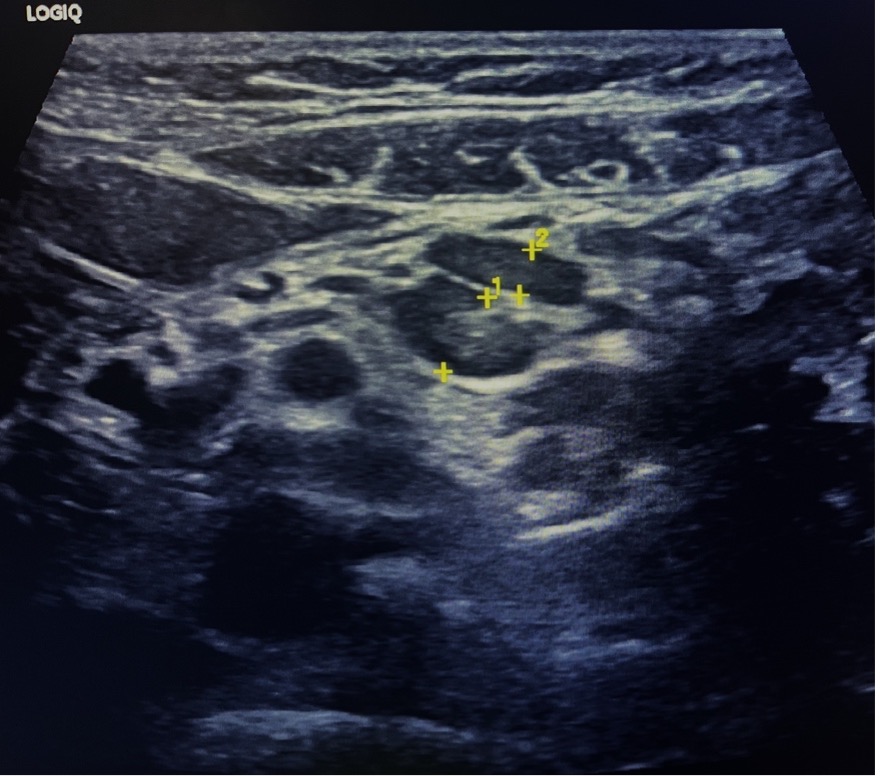
- Assess the size, shape, echogenicity, borders, and vascularity of any lymph nodes.
- Apply color doppler to assess vascular flow to the area
- Document and describe characteristics of the mass.
- Describe any adjacent tissue findings
*Usually this requires turning the head away from the swelling and in extension. This might be achieved by placing the patient in a semi recumbent position or in a caregiver’s lap, which might offer some gentle holding as well as comfort
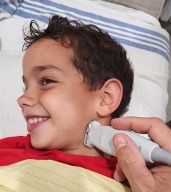
Figure 1. Probe positon
When examining any neck swelling or mass using ultrasound, it’s crucial to observe and comment on the following characteristics:
Margins
o Are the margins smooth?
o Is there any definable capsule?
Shape/Size
o Describe the mass in three dimensions: Ovoid? Round? Irregular?
o The axial short-axis diameter and overall dimensions, if feasible
Echogenicity/internal structure
o Echotexture: Homogeneous? Heterogeneous? Echogenicity?
o Architecture: Shape? Lobulations?
o Is there a central hilum?
o Unique features: Ducts? Calcifications? Foreign body? Shadowing or other artifacts within?
Surrounding tissue
o Tissue thickening, edema, cobblestoning or echogenic fat?
o Relationship to other structures such as skin, subcutaneous fat, muscle, bone, glands: adjacent? embedded within? attached to? infiltrating?
o Artifacts in surrounding tissue: Posterior acoustic enhancement? Shadowing?
o Do the combinations of these indicate gas or fluid in the tissue?

Vascularity
o Is there increased flow? (Compared to an expected and/or similar structure)
o Location of vascularity: Radiating from a hilum? Peripheral? Adjacent vascular structures?

