
The left upper quadrant
The left upper quadrant view uses the spleen as a window to identify free fluid within the abdominal cavity.
Technique (figure 4)
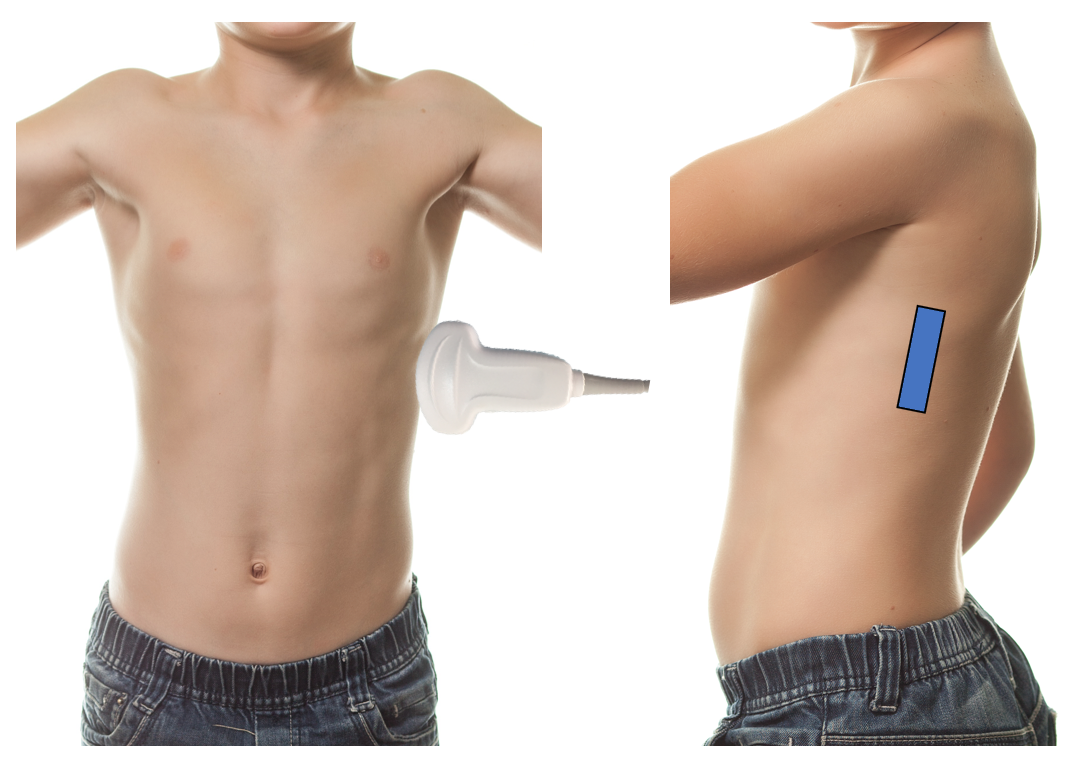
Figure 4: LUQ scanning technique
- Positioning is critical. It is important that the patient remains supine in a flat or slight Trendelenburg position to ensure any fluid collects in dependent areas.
- Place the probe on the patient’s left posterior-axillary line at the level of the xyphoid.
- Probe indicator toward the patient’s head.
- Center the splenorenal interface on the screen by moving up or down an intercostal space as needed.
- Fan slowly from anterior to posterior and back again looking for fluid around the superior and inferior poles of the spleen as well as in the splenorenal interface.
- Fluid appears as anechoic (black) on the screen
Tips
- The spleen is smaller and lies more posterosuperior within a patient necessitating adjustment of probe placement accordingly. This is particularly true when dealing with a gaseous stomach.
- The spleen is not bound by ligaments like the liver thus the full area around the spleen must be investigated: superior, perirenal and inferiorly.
- The diaphragm (superior portion) can be tricky to assess due to the proximity of the air-filled lung base. It may be helpful to slide the probe anteriorly and then tip the probe posteriorly to optimize this view.
- Remember to fan slowly from posterior to anterior and back, visualising each area of interest in its entirety.
- It is common to have to fan in multiple rib spaces to ensure a view of the whole splenorenal interface and caudal splenic edge.
- If struggling with rib shadows, consider angling the probe to be in line with the intercostal space.
What am I looking at?
When placing the probe in the LUQ you are using the spleen as an acoustic window to get a coronal cross section of the patient’s abdomen (figure 5). Unlike the liver, the spleen is mobile and thus the entire area around the spleen must be investigated for fluid, including: (1) the sub-diaphragmatic space (superiorly), (2) the splenorenal interface and (2) the caudal tip of the spleen.
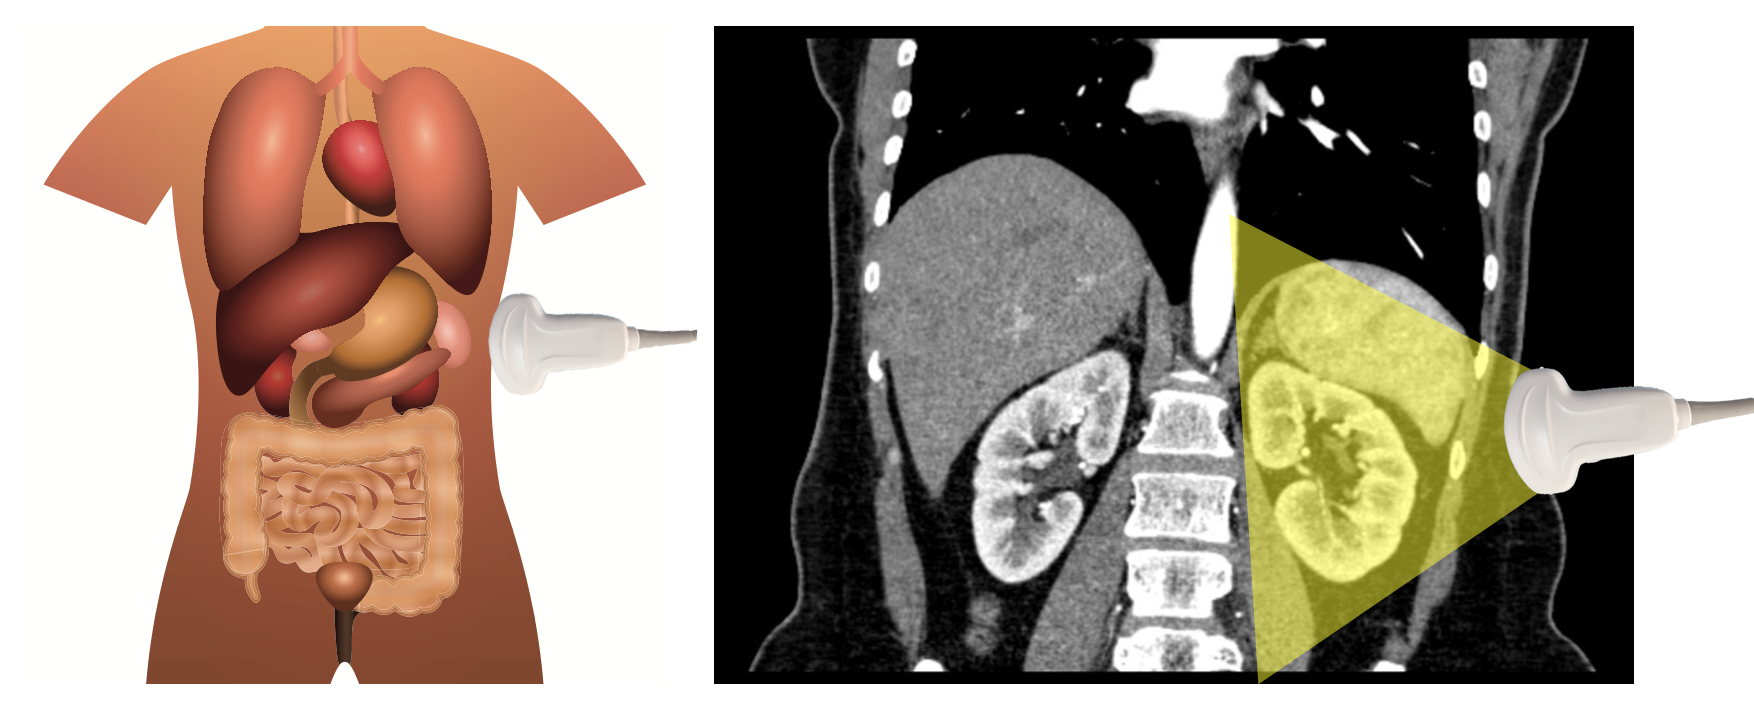
Figure 5: When scanning the left upper quadrant, one uses the spleen as an acoustic window to get a coronal view of the spleen, right kidney and splenorenal interface.
What is normal?
Superficially, the ribs and chest wall are most easily identified by hypoechoic rib shadows projecting into the abdomen. Deep to the chest wall, the spleen is encountered, followed by the splenorenal interface and left kidney (figure 6, video 4).
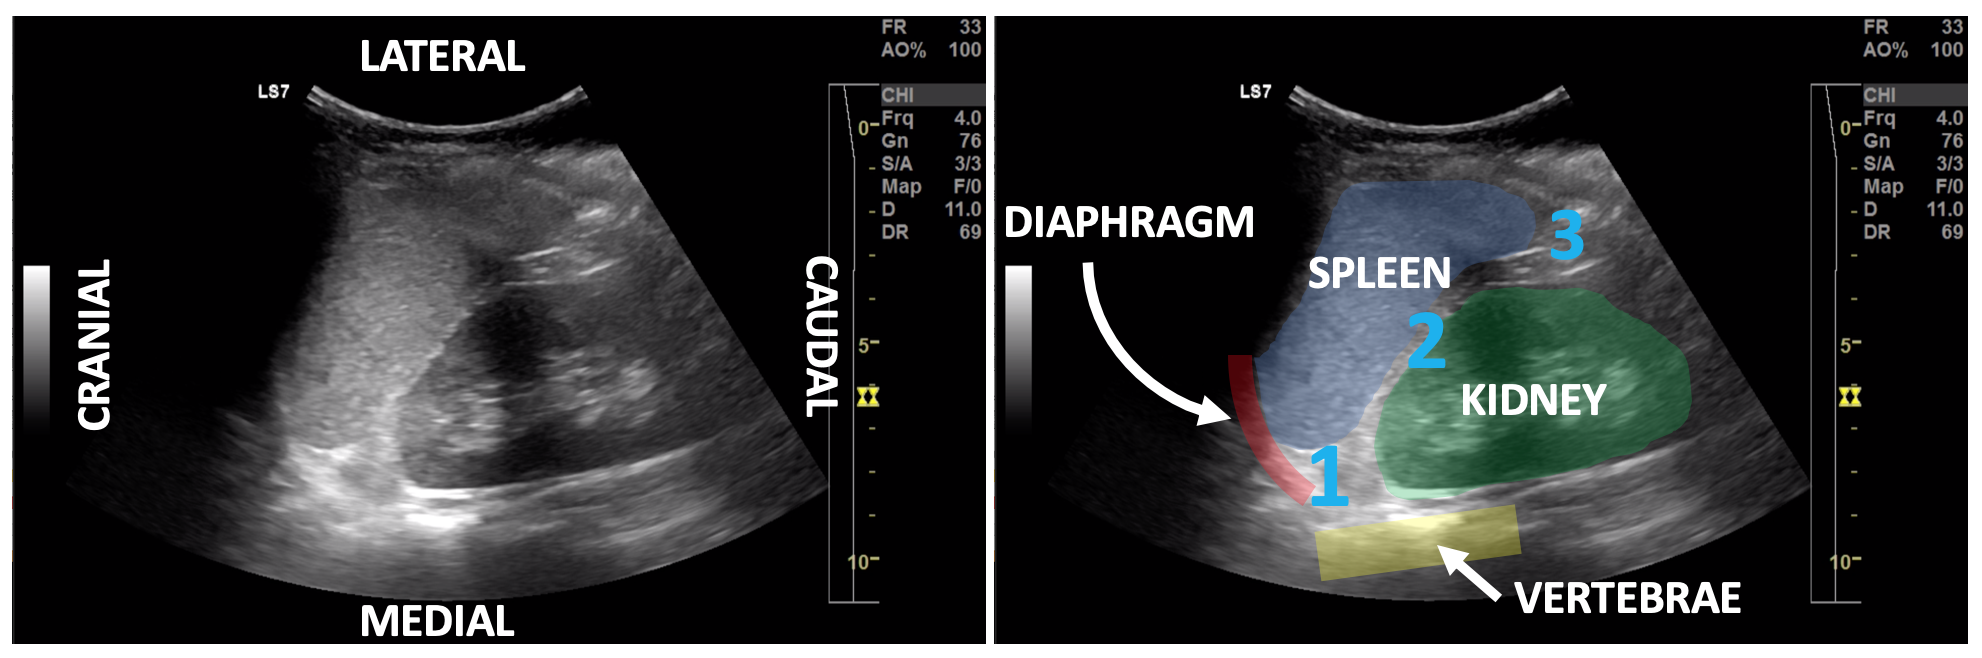
Figure 6: Normal LUQ sonoanatomy with the spleen highlighted in blue, left kidney in green, diaphragm in red and vertebral bodies in yellow. Areas of interest include the superior pole of the spleen including the subdiaphragmatic space (1), splenorenal interface (2) and the inferior pole of the spleen (3).
Video 4: LUQ, normal view
What is not normal?
Free fluid appears as anechoic stripes or collections around the spleen (video 5).
Video 5: LUQ, free fluid
Pitfalls
Similar to the right upper quadrant, false negative scans are most commonly caused by operator error—due to failing to fully investigate circumferentially around the spleen small amounts of fluid being present or clotted blood. False positives due to perinephric fat and edge artifact also occur in the left upper quadrant. The stomach bubble can also interfere with image interpretation, obscuring free fluid in some cases and mimicking it on others. Differentiating stomach from other structures can be done via anatomic location, appearance of the heterogenous contents and presence of the stomach wall.
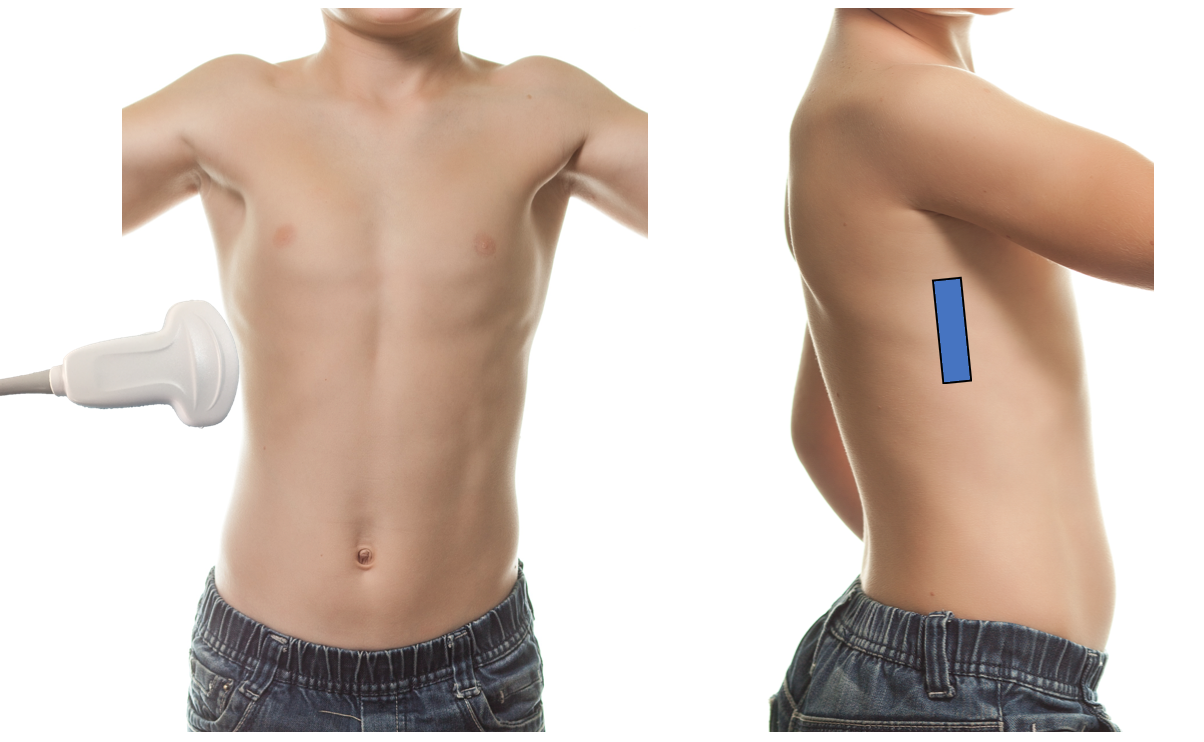
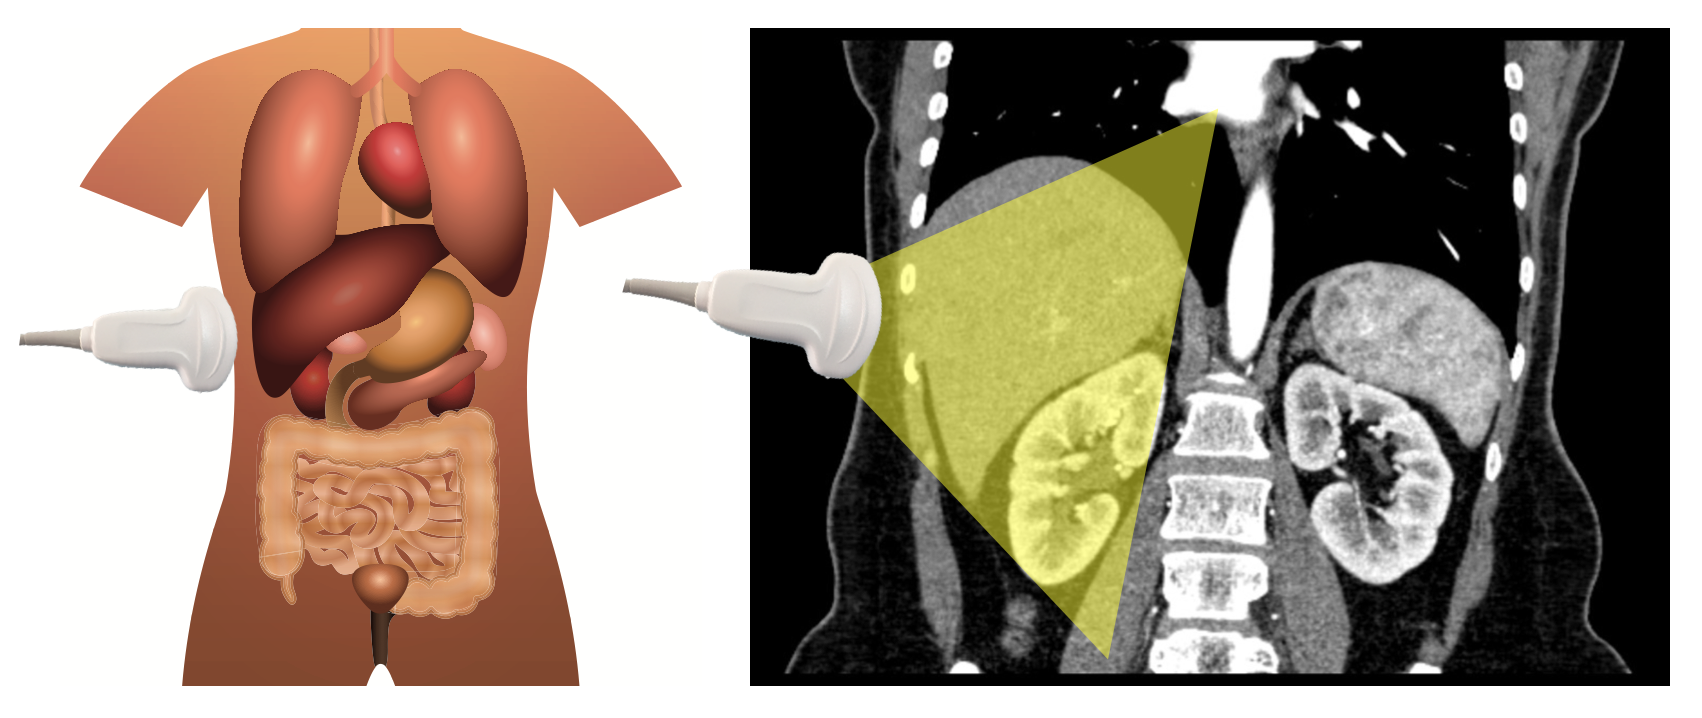


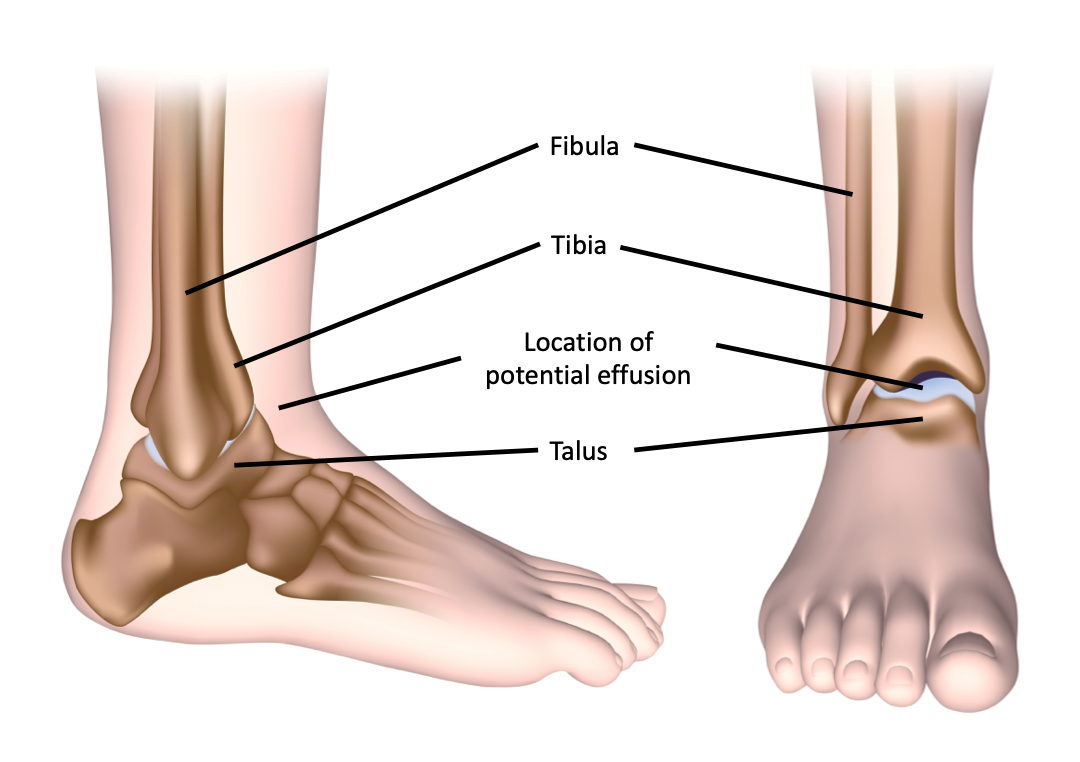 Figure 18: Anatomy of the ankle joint.
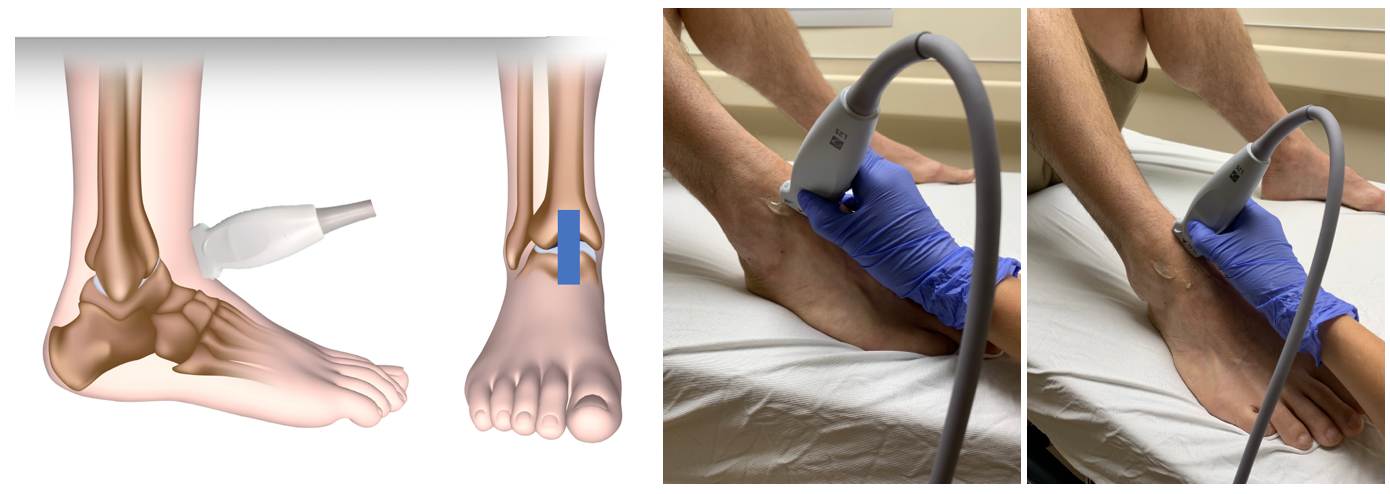 Figure 19: Probe position for ankle ultrasound.
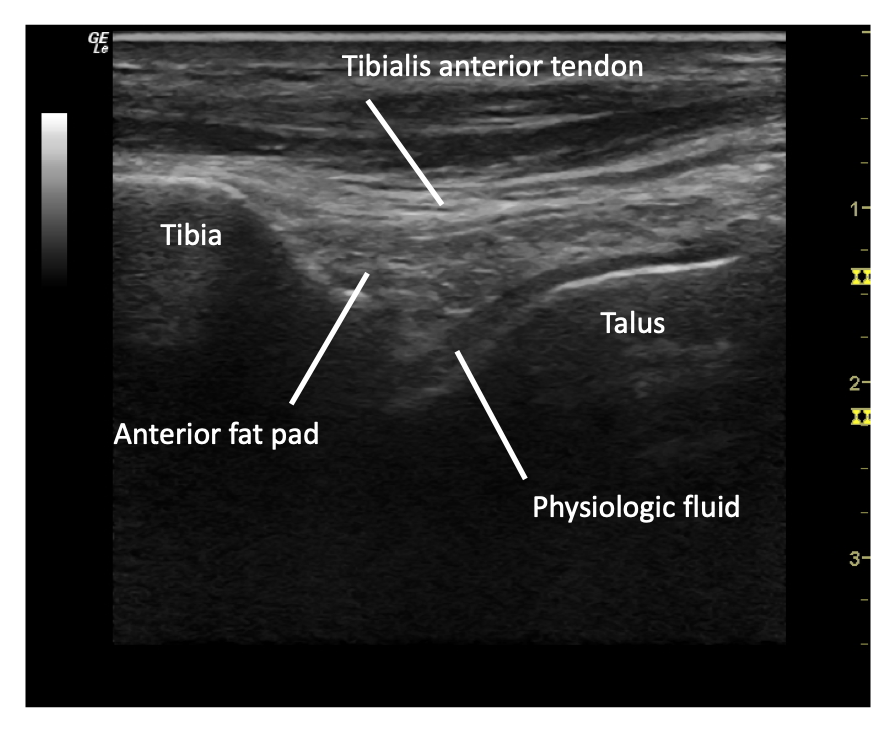 Figure 20: Labelled normal ankle ultrasound. Note that physiologic fluid and cartilage can appear similarly, so differentiate them with compression of the structures. Fluid will compress, cartilage will not.
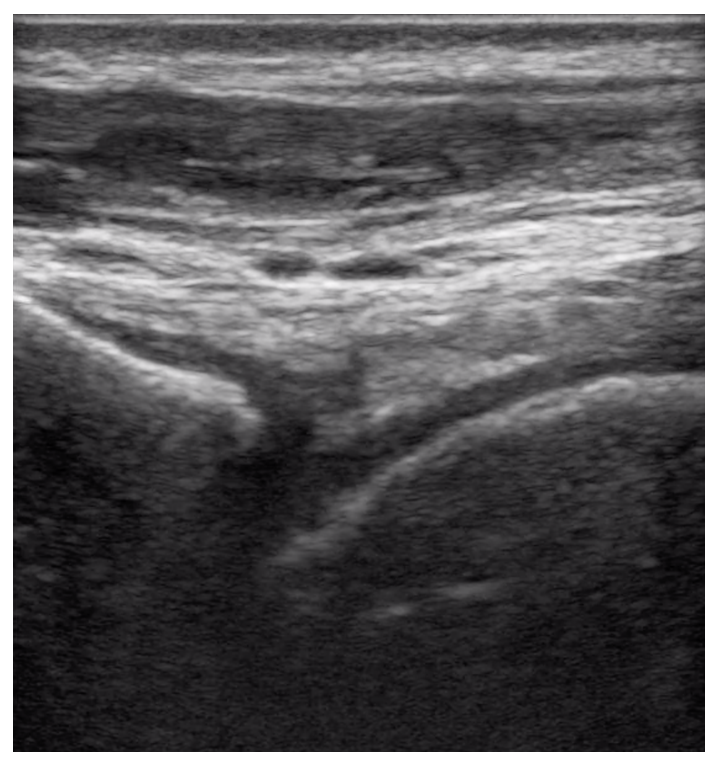 Figure 21: Normal ankle ultrasound.
 Figure 22. Normal pediatric ankle ultrasound appearances in children aged 2, 4, and 8 years, demonstrating age-related changes in the amount and appearance of cartilage and ossification. The examples illustrate the progressive ossification of the developing skeleton, with relatively greater hypoechoic cartilage in younger children and increasing echogenic ossification with age
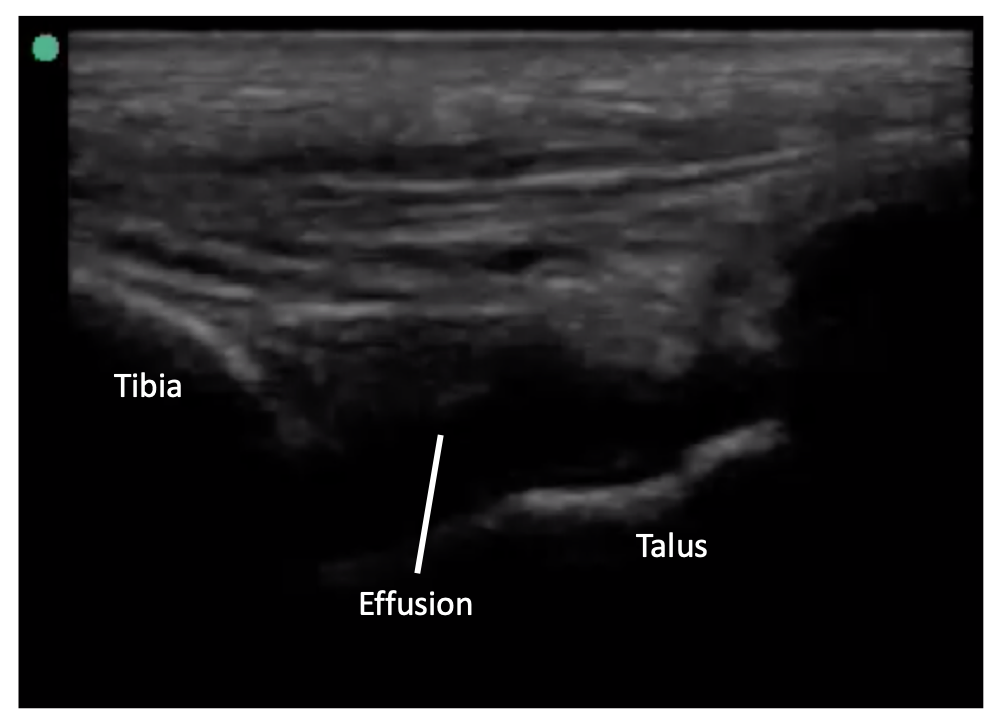 Figure 23: Positive ankle effusion.
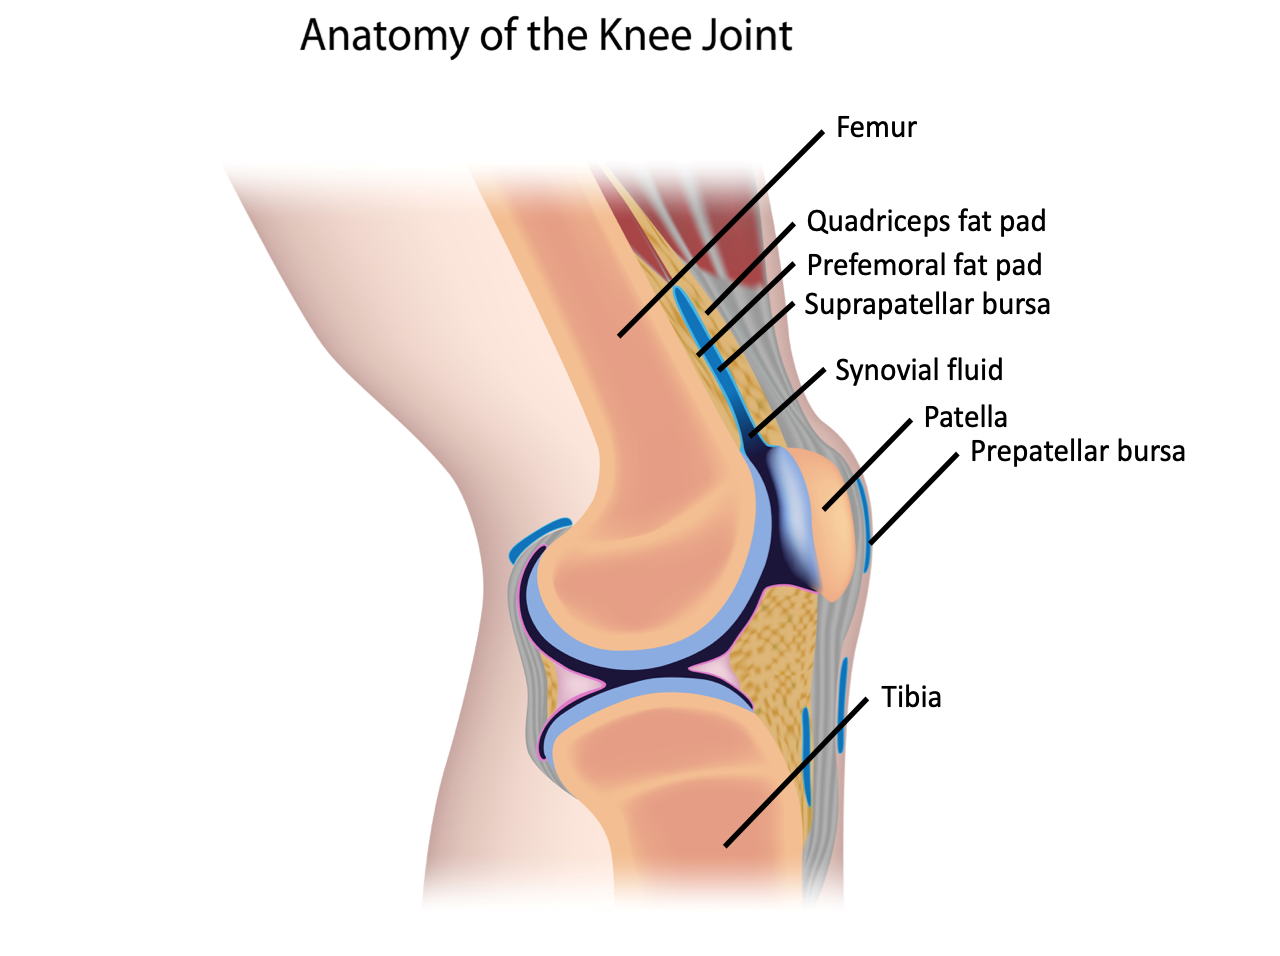 Figure 12: Anatomy of the knee joint.
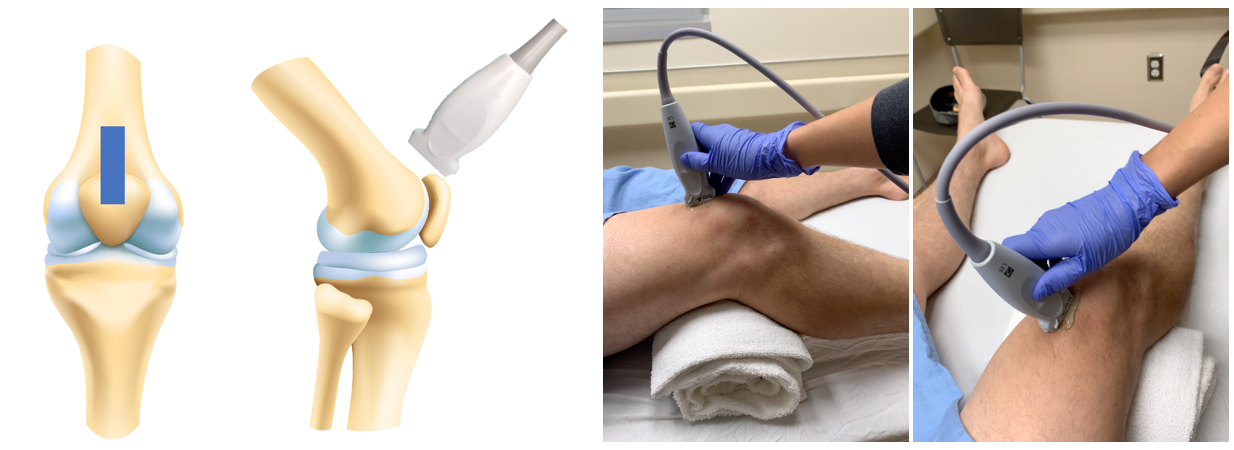 Figure 13: Probe position for knee ultrasound
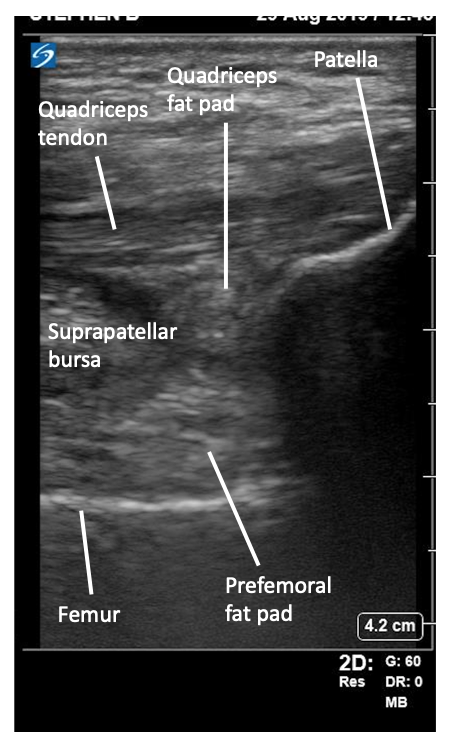 Figure 14: Labelled normal knee ultrasound.
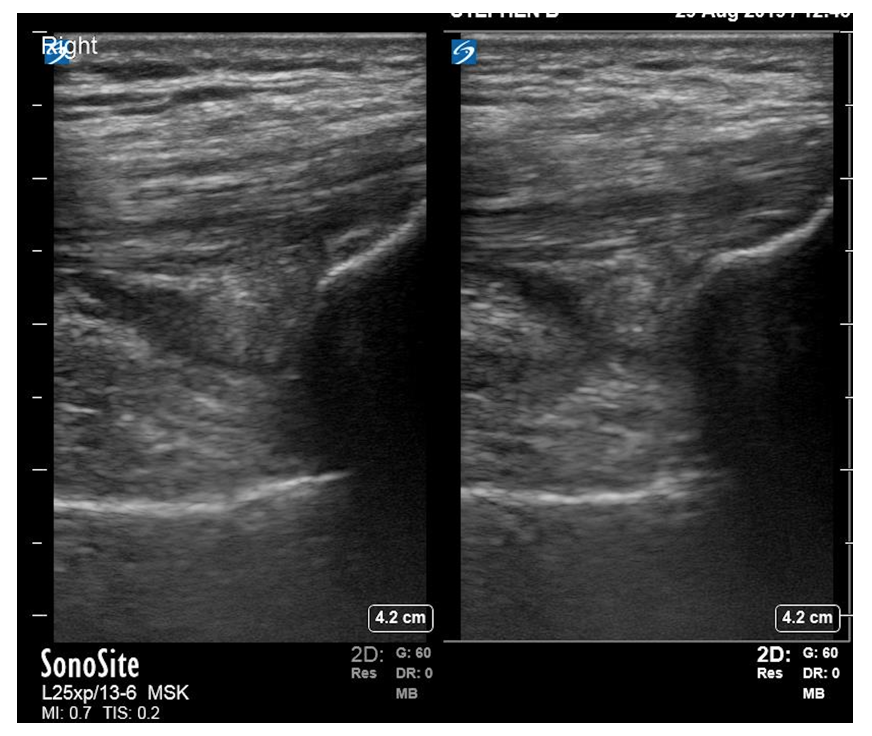
 Figure 16. Normal pediatric knee ultrasound appearances in children aged 2, 4, and 8 years, demonstrating age-related changes in the amount and appearance of cartilage and ossification. The examples illustrate the progressive ossification of the developing skeleton, with relatively greater hypoechoic cartilage in younger children and increasing echogenic ossification with age.
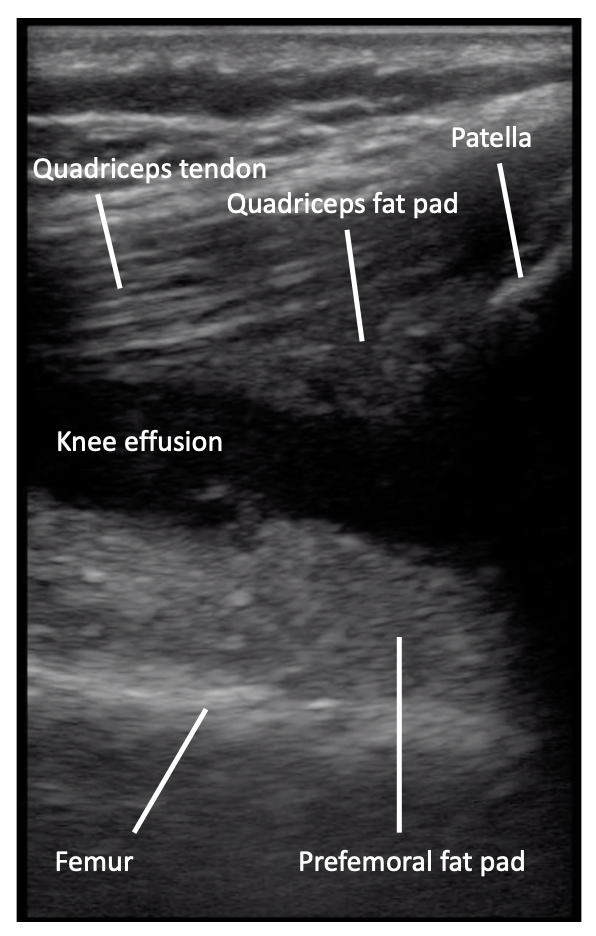 Figure 17: Positive knee effusion.