Archives
Systematic Approach to Assessing Lymph nodes
Lymph node scanning tutorial
References
**To unlock access to the first quiz, make sure to select the “Mark as Completed” button below
References
- Meier JD, Grimmer JF. Evaluation and management of neck masses in children. Am Fam Physician. 2014 Mar 1;89(5):353–8. PMID: 24695506.
- Kadom N, Lee EY. Neck masses in children: current imaging guidelines and imaging findings. Semin Roentgenol. 2012 Jan;47(1):7–20. doi: 10.1053/j.ro.2011.07.002. PMID: 22166227.
- Rosenberg HK. Sonography of pediatric neck masses. Ultrasound Q. 2009 Sep;25(3):111–27. doi: 10.1097/RUQ.0b013e3181b6720b. PMID: 19730051.
- Levine MC, Arroyo A, Likourezos A, Homel P, Dickman E. The use of point of care ultrasound in the evaluation of pediatric soft tissue neck masses. Am J Emerg Med. 2019 Aug;37(8):1466–9. doi: 10.1016/j.ajem.2018.10.048. PMID: 30389115.
- Friedman N, Tseng F, Savic R, Diallo M, Fathi K, Mclean L, Tessaro MO. Reliability of neck mass point-of-care ultrasound by pediatric emergency physicians. J Ultrasound Med. 2019 Nov;38(11):2893–900. doi: 10.1002/jum.14993. PMID: 30937939.
- Claiborne MK, Ng C, Breslin KA, Chamberlain J, Thomas-Mohtat R. The effect of point-of-care ultrasound on length of stay in the emergency department in children with neck swelling. Am J Emerg Med. 2021 Oct;48:295–300. doi: 10.1016/j.ajem.2021.05.009. PMID: 34052608.
- Doniger S. Pediatric Emergency and Critical Care Ultrasound. Cambridge: Cambridge University Press; 2014.
- Spijkers S, Littooij AS, Nievelstein RAJ. Measurements of cervical lymph nodes in children on computed tomography. Pediatr Radiol. 2020;50:534–42. doi: 10.1007/s00247-019-04582-0.
- Ahuja AT. Diagnostic Ultrasound: Head and Neck. Amsterdam: Elsevier; 2014.
- Koch BL, Vattoth S, Chapman PR. Diagnostic Imaging: Head and Neck. 4th ed. Philadelphia: Elsevier Health Sciences; 2021. ISBN: 9780323796521.
- Hirvonen J, Heikkinen J, Nyman M, Happonen T, Velhonoja J, Irjala H, et al. MRI of acute neck infections: evidence summary and pictorial review. Insights Imaging. 2023 Jan 8;14(1):5. doi: 10.1186/s13244-022-01347-9. PMID: 36617619; PMCID: PMC9826778.
Summary
Summary
PoCUS is a valuable tool in the assessment of pediatric neck masses. It allows for real-time assessment, offers clinically relevant images, and avoids ionizing radiation. PoCUS images are easily obtained to help guide clinical management, and recognition of the ultrasound features of various lymph node pathologies is critical for accurate interpretation.
PoCUS can…
o Assist in assessing acute neck swelling in children
o Decrease length of stay
o Guide clinical management
Tips for Success:
Obtaining images: Use the linear probe, scan in 2 planes, and use color doppler
Assessing the findings: Size, shape, echogenicity, borders, and vascularity of the nodes
Documenting your impression: Share your findings and impression in the patient chart if you are comfortable, competent, and credentialed
Share: Save images for ongoing patient care, quality assurance, and education
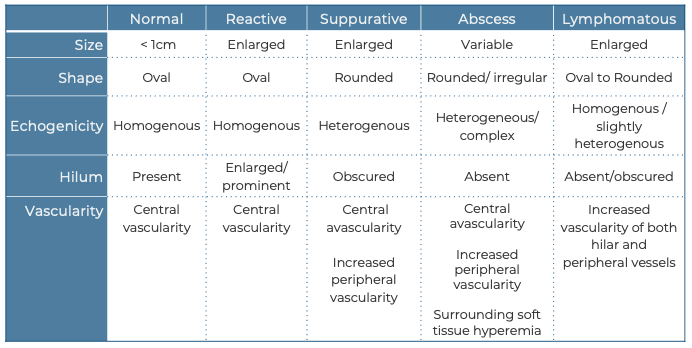
Summary Table
Pitfalls and Challenges
Pitfalls & Challenges
Recent evidence emphasizes the reliability and safety of PoCUS in assessing neck swelling in children. However, the majority of current evidence derives from the radiology literature and further research is needed to evaluate the effectiveness and usefulness of PoCUS for these applications.
Many conditions leading to neck swelling cause local tenderness. This discomfort may make examination difficult. Pain can be managed by administering systemic analgesia and/or applying a generous layer of ultrasound gel to minimize direct probe contact and reduce the pressure needed to obtain images.
While ultrasound is effective in evaluating relatively superficial pathologies, it is not as dependable for assessing deeper neck structures and spaces, making pathologies, such retropharyngeal infection/abscess more challenging to assess. In these instances, modalities such as CT or MRI are superior. (9,10)
When assessing findings in the pediatric neck, it is also important to consider a broad differential diagnosis, as not all abnormalities represent reactive nodes and premature diagnostic closure on this common condition is a risk. Other conditions may resemble lymph nodes, including benign or malignant solid tumors, congenital cysts, and abscesses.
What is NOT normal
What is NOT normal
Reactive Lymph Node
Usually due to a benign, reversible enlargement of nodes in response to antigenic stimulus. In the pediatric population, the etiology usually is secondary to viral or bacterial pathogens. Viral infections are the most common cause of reactive adenopathy.(9) Lymph node involvement may be acute or chronic, localized or generalized.
Size: Reactive lymph nodes are usually larger than normal lymph nodes.
Shape: Reactive nodes maintain their normal ovoid shape, except in the submandibular region where they are usually round.
Echogenicity: Primarily homogenous.
Internal structure: Persevered normal node architecture, with a hypoechoic cortex and a hyperechoic medulla, and fatty central hilum.
Surrounding tissue: Typically, no or limited inflammatory changes in the surrounding tissues of normal or reactive lymph nodes
Vascularity: Color Doppler imaging reveals more prominent vessels at the hilum. Hilar vascularity may be pronounced, with vessels extending from the hilum to the periphery of the node.
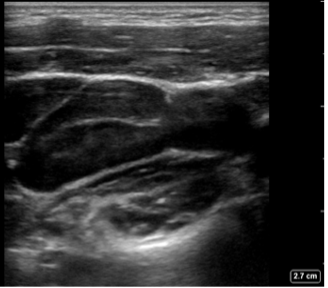
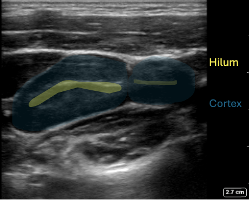
Figure 5. Reactive Lymph nodes in a longitudinal plane: Enlarged oval shaped node, expected echotexture with a hypoechoic cortex and more echogenic central hilum. Note the absence of hyperechoic fat surrounding the node
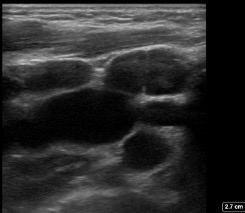
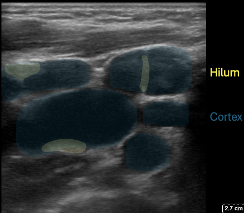
Figure 6: In the transverse plane multiple oval shaped nodes with the expected echogenicity
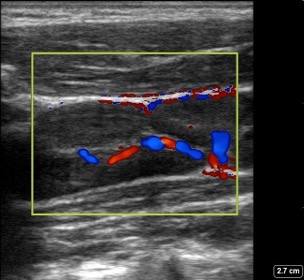
Figure 7: Reactive Lymph node in a longitudinal plane with color Doppler: shows increased hilar vascularity.
Suppurative Lymphadenitis
Suppurative lymphadenitis is caused by an infection of one or more nodes. The most common pathogens are Staphylococcus aureus and group A streptococcus (GAS). This might occur following reactive lymphadenopathy with opportunistic infection by bacteria found typically in the ear, nose, throat, and on the skin. Infections that occur after dental or oral surgeries are more typically polymicrobial, with anaerobic bacteria more frequent (9).
Size: Typically enlarged node or confluence of nodes. Usually 1-4 cm in greatest dimension.
Shape: Ovoid to round.
Echogenicity: Heterogenous with areas of decreased and increased echogenicity.
Internal structure: The node appears hypoechoic with irregular wall thickness but preserved wall margin. The central hilar stripe is not visible. Internal hyperechoic areas are present, indicating the presence of purulent material and debris.
Surrounding tissue: Thickening can be observed in the surrounding tissues and subcutaneous layers. Often posterior acoustic enhancement is present.
Vascularity: Central avascularity, often with increased vascularity to the nodal periphery and to the inflamed surrounding soft tissues.
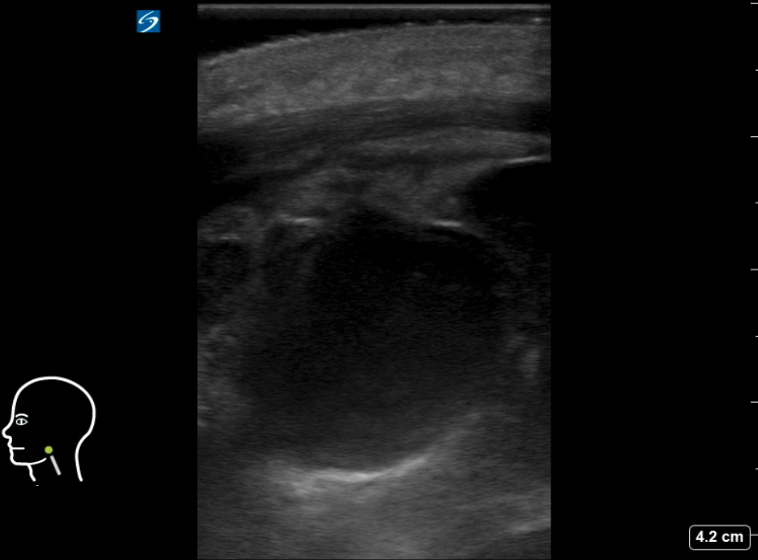
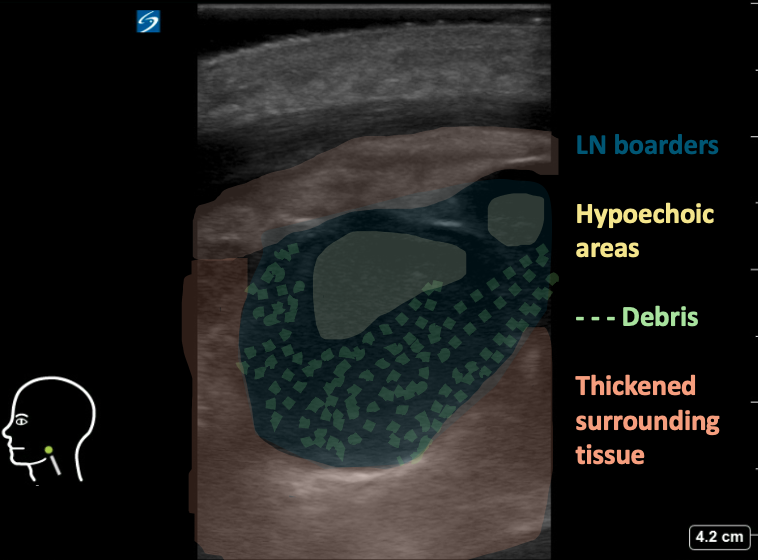
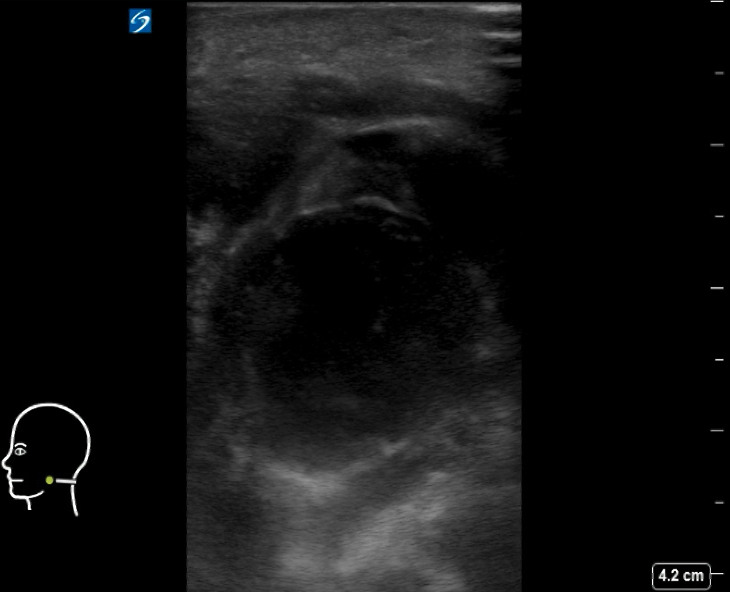
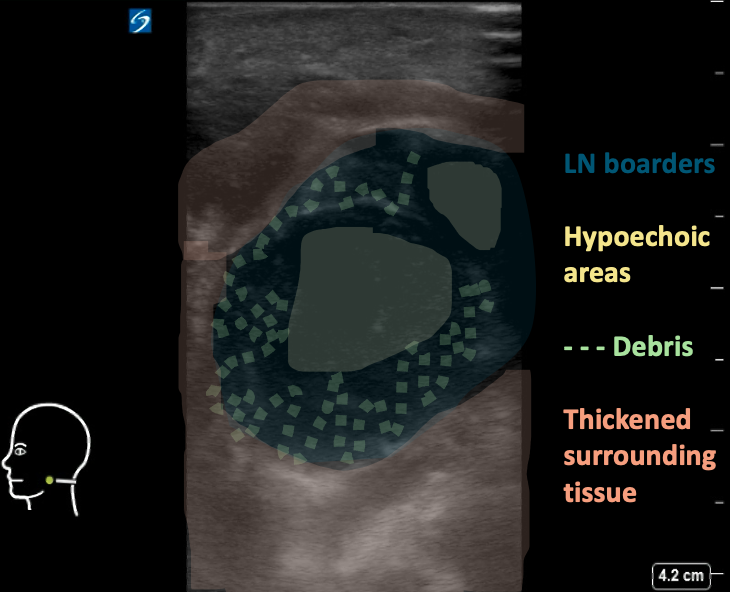
Figure 8AB: Suppurative cervical lymph node, in the longitudinal (A) and transverse (B) planes. Enlarged and round in both views, with loss of normal hilar architecture and heterogeneous echotexture including hypoechoic areas and peripheral debris. Note the thickening of the surrounding tissue.
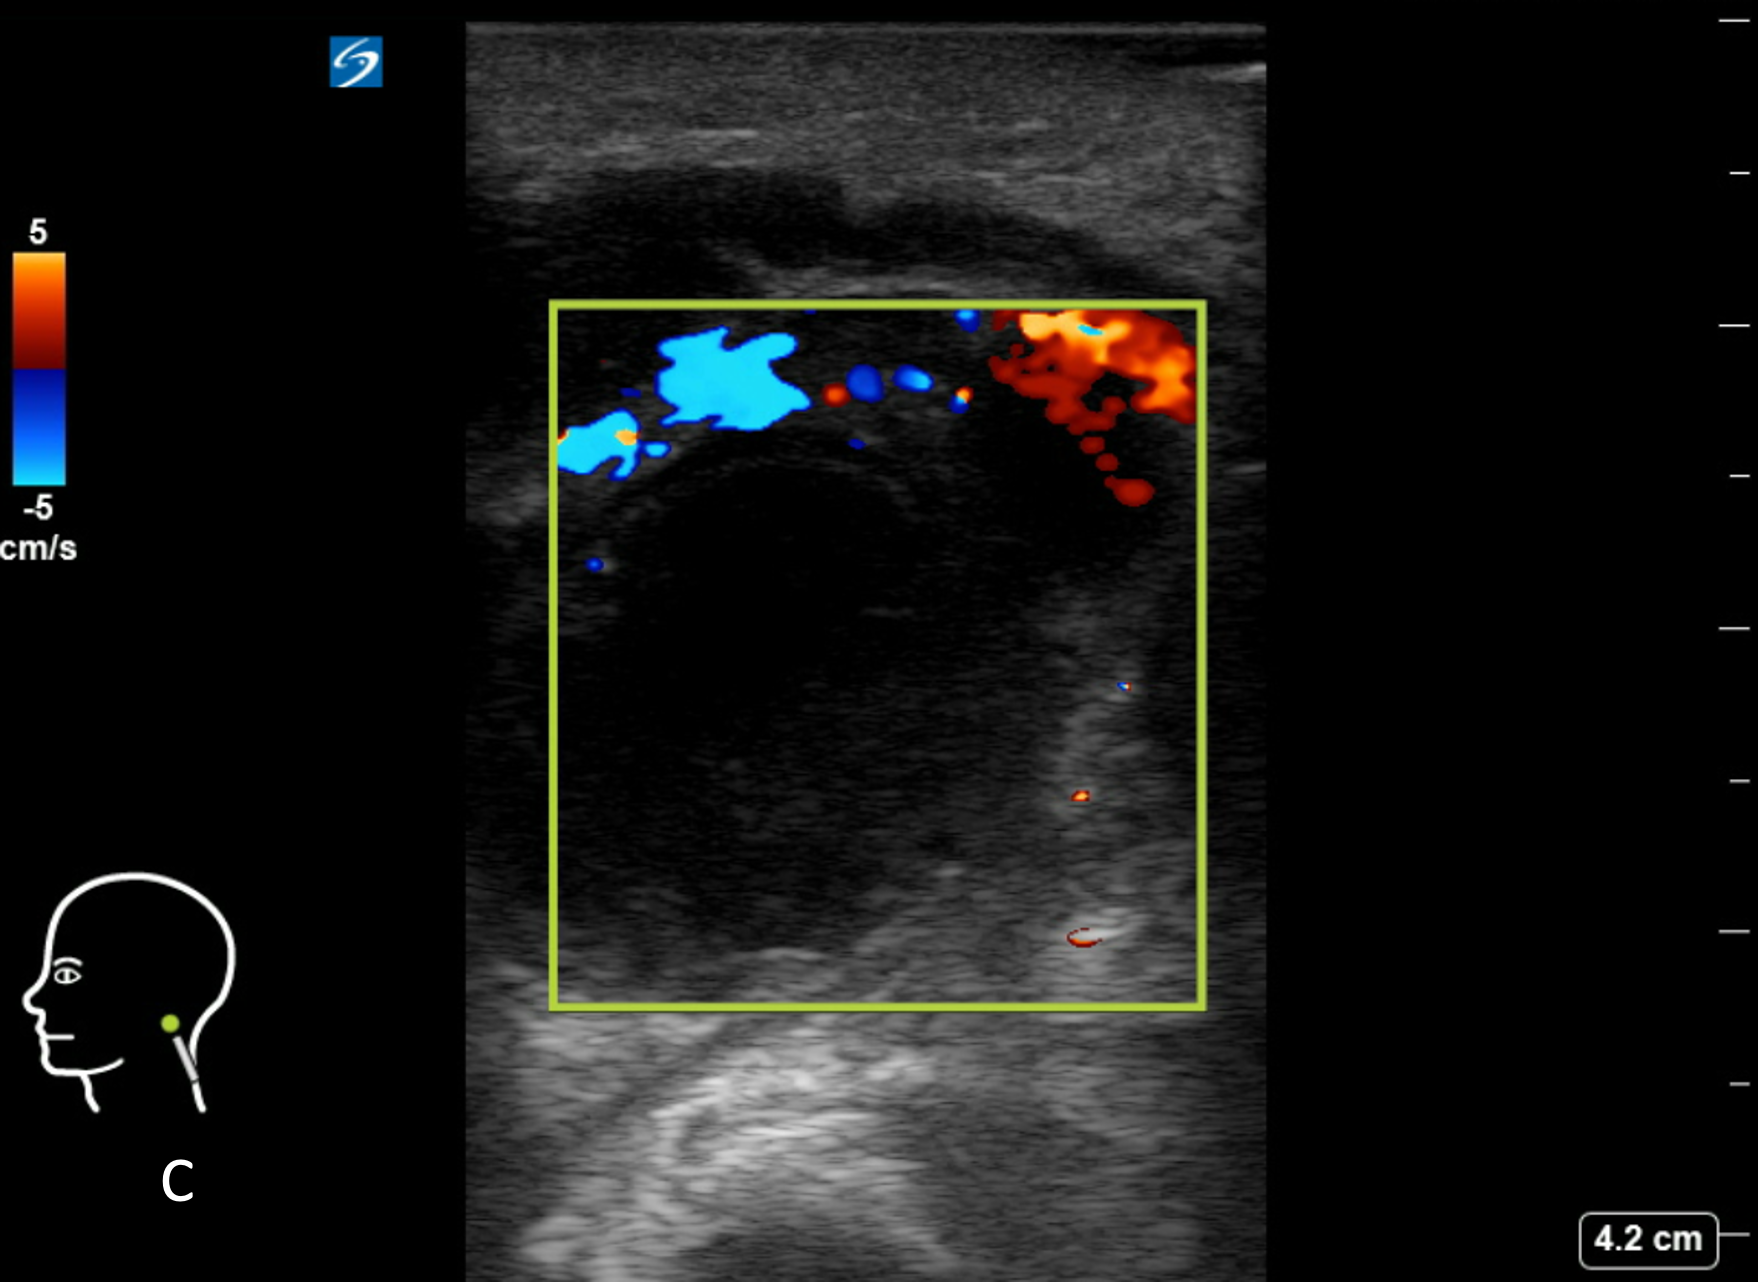
Figure 8C: Corresponding image with color Doppler. Central avascularity.
Abscess formation:
Suppurative lymphadenitis may progress and form an abscess.
Size: Usually 1-4 cm in greatest dimension, but might grow to a large size as well
Shape: Usually irregular shape and margins.
Echogenicity: Complex, heterogeneous, with hypoechoic or anechoic center.
Internal structure: Loss of normal nodal architecture, and heterogeneous echogenicity. Overall hypoechoic lymph node with internal hyperechoic areas, presenting purulent material and debris. Internal septations are also common. The presence of intensely echogenic, mobile spots with “dirty” shadowing strongly suggests the presence of air/gas bubbles.
Surrounding tissue: Thickening of both the tissue and subcutaneous layers in surrounding tissue. Fluid or edema within the subcutaneous layers is common, with hypoechoic strands of edema fluid,creating a “cobblestone” appearance.
Vascularity: Central avascularity, often with Increased vascularity to both the node periphery and surrounding inflamed soft tissues.
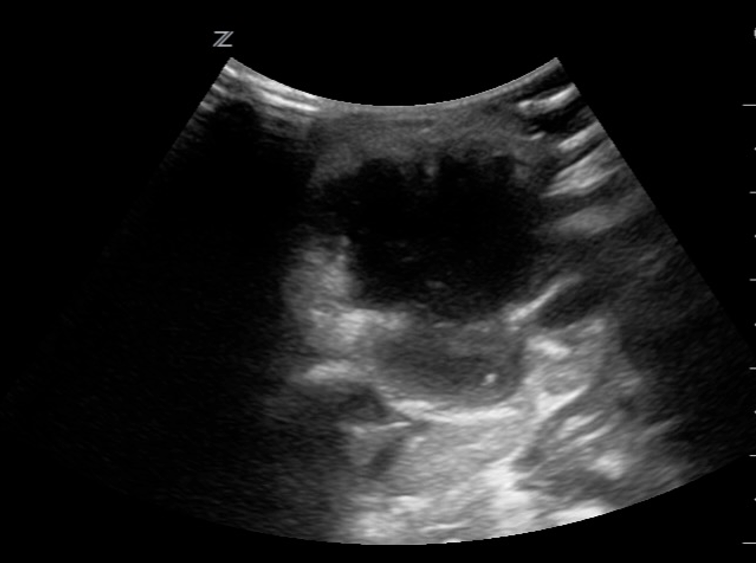
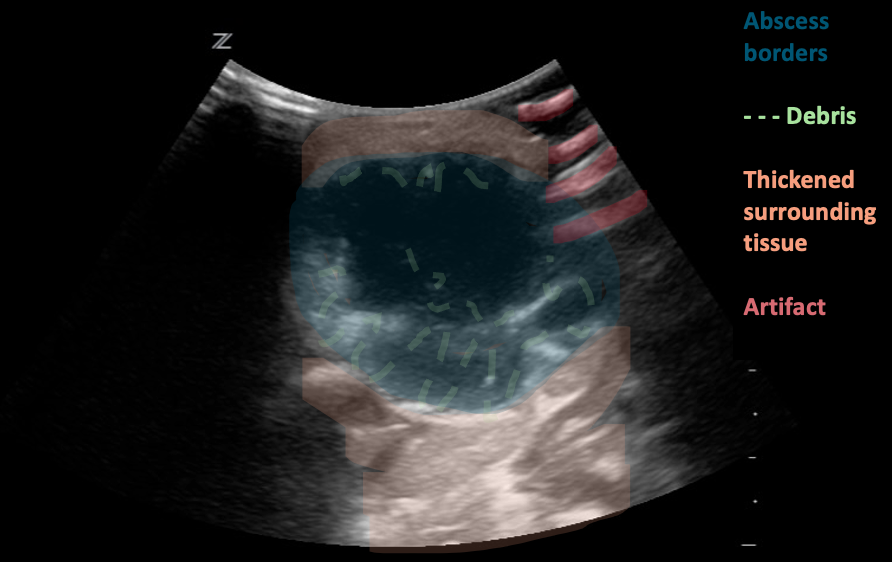
Figure 8: Neck abscess, transverse plane. Irregular shape and margins with anechoic regions and hyperechoic debris (likely purulent material). Edema and thickening of the surrounding tissues. Images courtesy of EDSonoShare, licensed under CC BY-NC-SA
Figure 9: Neck abscess, transverse plane. Irregular shape and margins with anechoic regions and hyperechoic debris (likely purulent material). Edema and thickening of the surrounding tissues. Video courtesy of EDSonoShare, licensed under CC BY-NC-SA
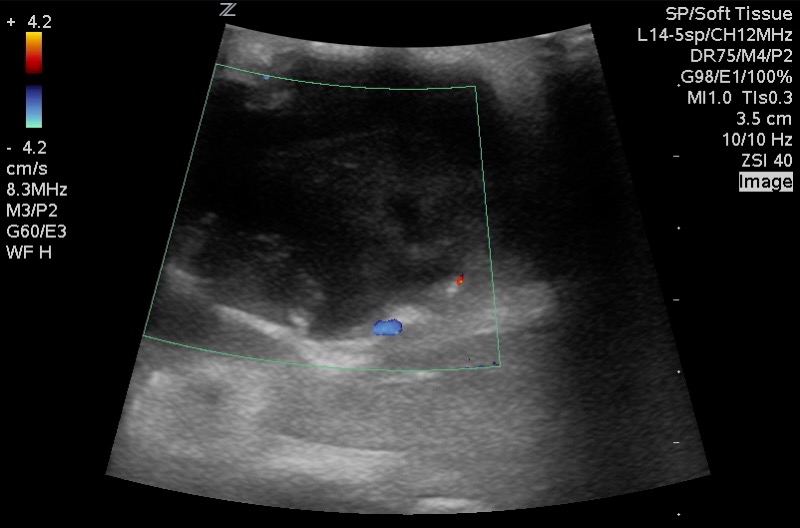
Figure 10: Corresponding image with Color Doppler. Central avascularity with increased peripheral flow. Images courtesy of EDSonoShare, licensed under CC BY-NC-SA
Lymphomatous nodes:
Lymph nodes can be affected by either Hodgkin’s or non-Hodgkin’s lymphoma. On its own, sonography cannot differentiate between these two types of lymphoma.
Size: Lymphomatous nodes typically exceed 10 mm in size in the transverse plane. Cervical node diameter alone is unreliable for distinguishing lymphomatous nodes from normal or from other pathological causes of node enlargement.
Shape: Usually round to elliptical and well-defined
Echogenicity: Homogenous or slightly heterogenous.
Internal structure: The nodes appear solid and hypoechoic in comparison to nearby muscle. The internal structure frequently displays intranodal reticulation or micronodular patterns. The echogenic hilum is often not present.
Surrounding tissue: Generally, does not show signs of inflammation (i.e. increased echogenicity). These nodes may display posterior acoustic enhancement.
Vascularity Most typically exhibit a mixed vasculature, including both hilar and peripheral vessels. Isolated peripheral vascularity is uncommon in lymphomatous nodes.
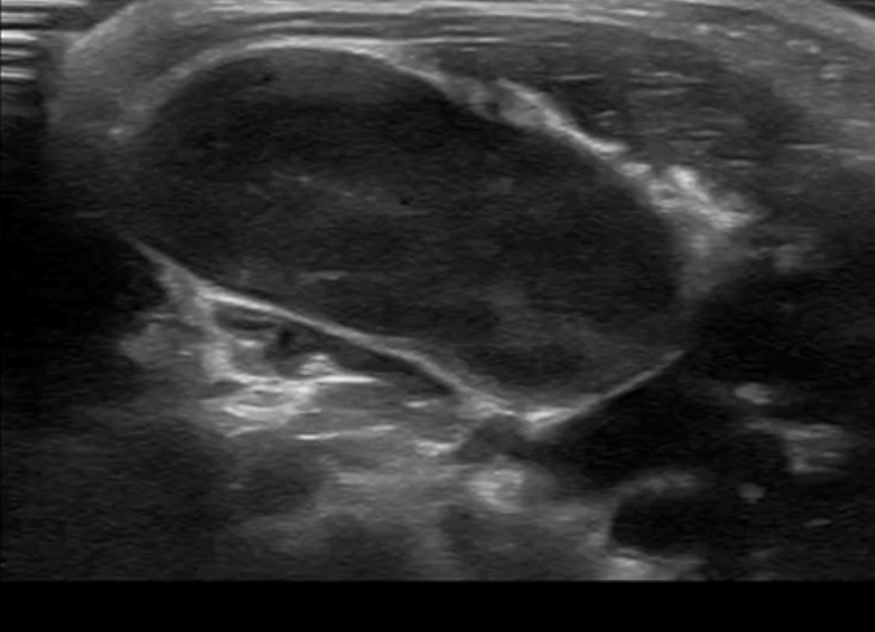
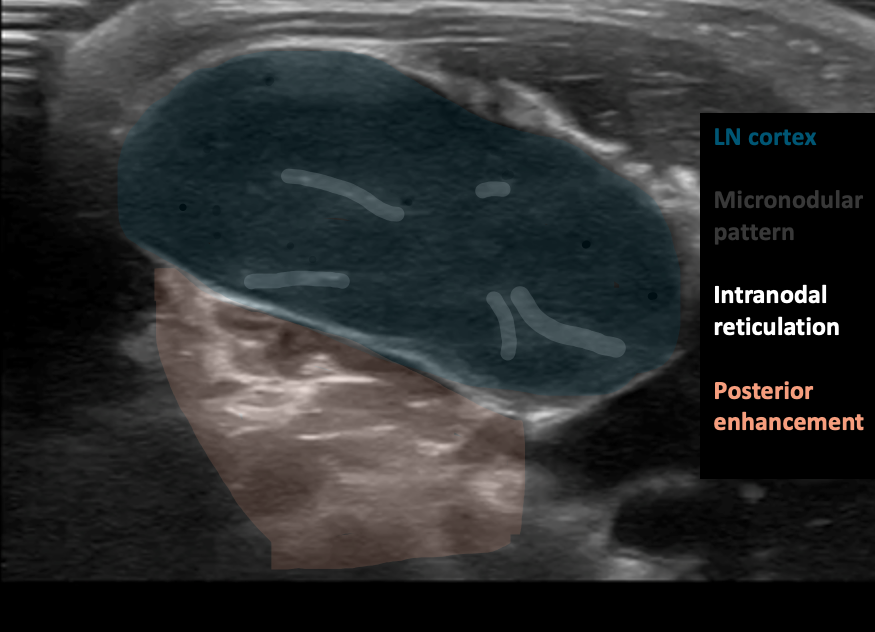
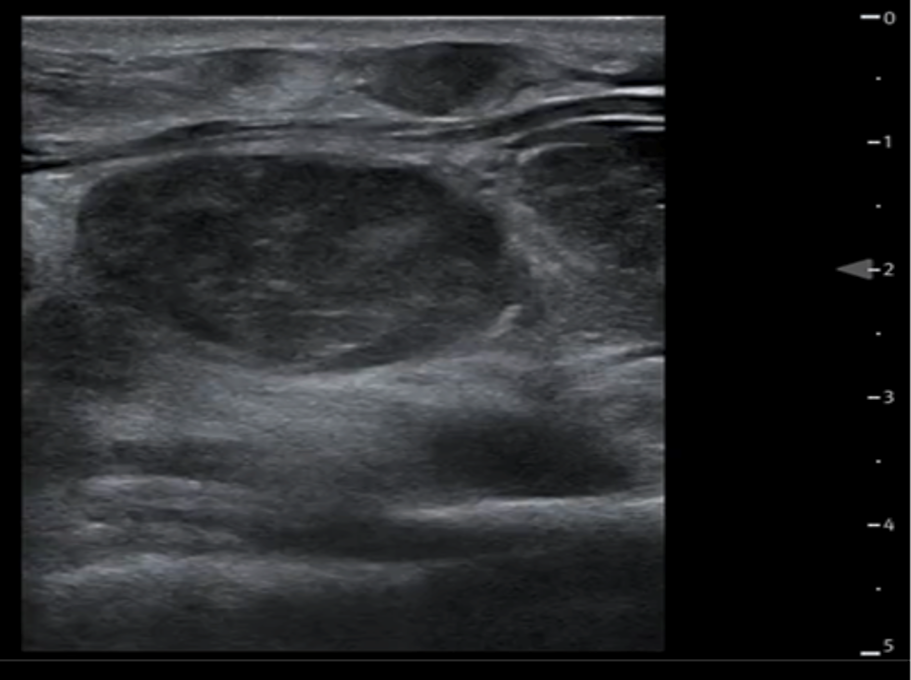
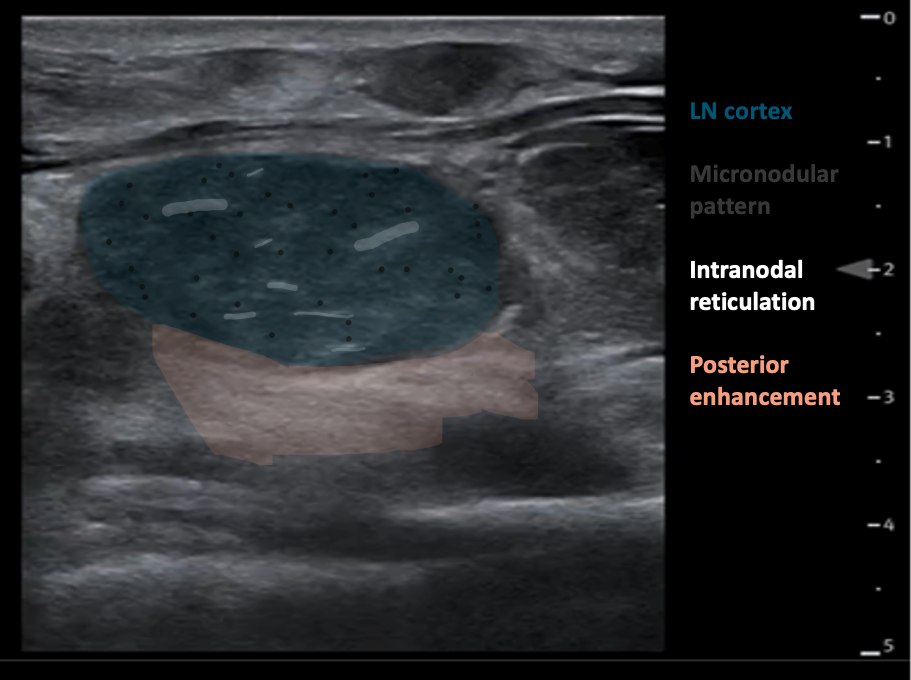
Figure 11AB: Lymphomatous node, in the longitudinal (A) and transverse (B) planes. Well-defined, solid, and hypoechoic, with a micronodular architecture and posterior acoustic enhancement. [Images courtesy of the SickKids de-identified image bank]
What is normal
What is Normal
Normal Lymph node:
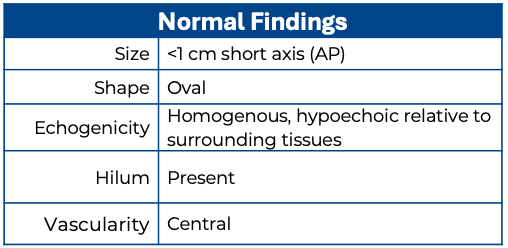
Size: Lymph Nodes in the head and neck are generally considered abnormal if they measure greater than 10 mm (1 cm) in the short axis. The exception is the submandibular region, where a short axis of up to 15 mm can be considered normal (8).
The axial short-axis diameter of lymph nodes is more clinically significant, whereas the length of the node in the long axis is less standardized and often less clinically significant. However, the lymph node should still be evaluated in all three planes for a comprehensive assessment. (8)
Shape: Normal lymph nodes are ovoid, or “kidney shaped.“ However, in the submandibular region a normal node can appear round rather than ovoid.
Echogenicity: Normal lymph nodes have a cortex and medulla. The outer cortex is more hypoechoic due to lymphoid follicles, while the central medulla is more hyperechoic due to a dense network of lymphatic cords and a central sharp linear hyperechoic fatty hilum containing blood vessels.
Surrounding tissue: In a normal or reactive lymph node, the surrounding tissue will not typically demonstrate anatomical or echogenic changes.
Vascularity: in a normal node, the central hilum is vascular on color Doppler.
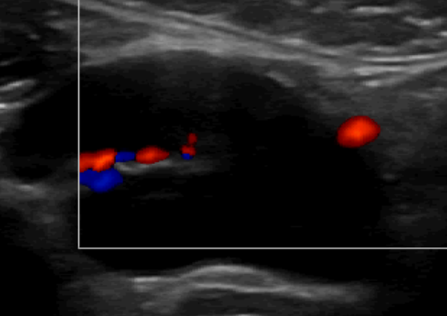
Figure 4. Normal Lymph node with color Doppler.
What am I looking at?
What am I looking at?
Lymph nodes are solitary ovoid structures composed of lymphoid tissue and are distributed along the lymphatic vessels.
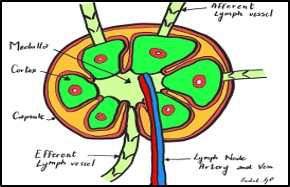
Figure 2. Lymph node- illustration. Image Source: Dr. Giulia Pula 2024.
Each node is divided internally into cortex and medulla and encased by a capsule. Artery and vein enter and exit the lymph node at the hilum.
On ultrasound, the skin and subcutaneous tissue are the most superficial layers, with muscle groups just beneath. Depending on the location of the lymph node, you may also see surrounding structures such as the carotid artery, internal jugular vein, trachea, or adjacent glands (e.g., thyroid, submandibular). The lymph nodes themselves are visualized within the soft tissue between these landmarks. Vessels will appear as anechoic structures, tubular and elongated in the long axis or round and circular in the short axis, while glands demonstrate a more homogeneous, finely echogenic texture compared to surrounding muscle.
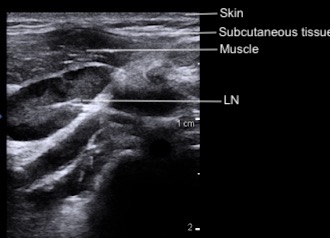
Figure 3: Cervical layers and normal lymph node on POCUS
Technique
Technique
- Place patient comfortably supine
- Position neck to best expose the swelling*
- Apply lots of gel for comfort if the area is tender (7)
- Consider pre-procedural analgesia
- Using the linear transducer, scan the area of interest in the longitudinal plane
- Scan the area of interest in the transverse plane.
- Assess the size, shape, echogenicity, borders, and vascularity of any lymph nodes.
- Apply color doppler to assess vascular flow to the area
- Document and describe characteristics of the mass.
- Describe any adjacent tissue findings
*Usually this requires turning the head away from the swelling and in extension. This might be achieved by placing the patient in a semi recumbent position or in a caregiver’s lap, which might offer some gentle holding as well as comfort

Figure 1. Probe positon

When examining any neck swelling or mass using ultrasound, it’s crucial to observe and comment on the following characteristics:
Margins
o Are the margins smooth?
o Is there any definable capsule?
Shape/Size
o Describe the mass in three dimensions: Ovoid? Round? Irregular?
o The axial short-axis diameter and overall dimensions, if feasible
Echogenicity/internal structure
o Echotexture: Homogeneous? Heterogeneous? Echogenicity?
o Architecture: Shape? Lobulations?
o Is there a central hilum?
o Unique features: Ducts? Calcifications? Foreign body? Shadowing or other artifacts within?
Surrounding tissue
o Tissue thickening, edema, cobblestoning or echogenic fat?
o Relationship to other structures such as skin, subcutaneous fat, muscle, bone, glands: adjacent? embedded within? attached to? infiltrating?
o Artifacts in surrounding tissue: Posterior acoustic enhancement? Shadowing?
o Do the combinations of these indicate gas or fluid in the tissue?

Vascularity
o Is there increased flow? (Compared to an expected and/or similar structure)
o Location of vascularity: Radiating from a hilum? Peripheral? Adjacent vascular structures?
