What am I Looking at?
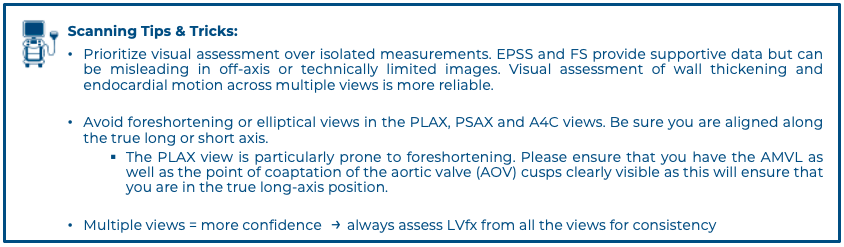
The PSAX view provides a cross-sectional image of the LV, allowing simultaneous visualization of multiple walls. It is the preferred view for global assessment of LVfx and RWMAs. This view is useful for assessing wall motion across the anterior, lateral, posterior, inferior, and septal segments, all seen in a single plane at multiple levels (basal, mid, apical) (figure 11).
A circular LV cavity indicates you’re on-axis, while an oval or elliptical shape suggests you’re off-axis and should adjust your probe angle for a true short-axis view.
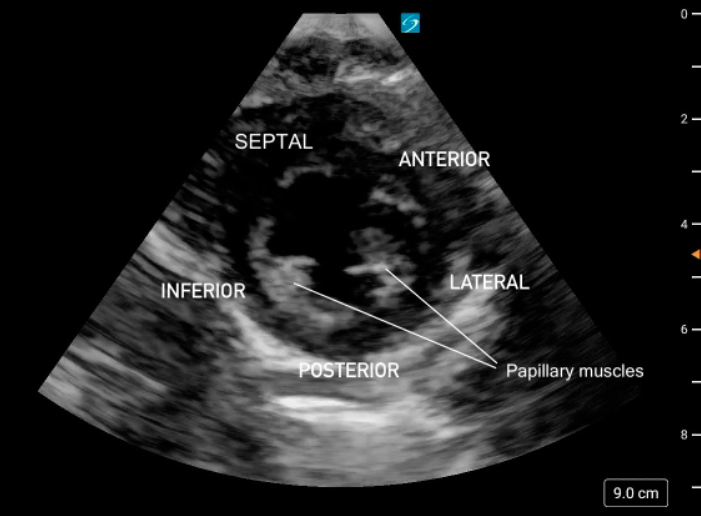 Figure 11. PSAX at the mid-papillary level with left ventricular walls labeled.
What is Normal
Contractility:
At each PSAX level, all LV walls should contract symmetrically, moving inward toward the center of the circular cavity and thickening evenly during systole. All walls should demonstrate coordinated inward motion and uniform thickening.
At the apical level, you may also notice a subtle twisting or rotational motion during systole, reflecting the normal torsional mechanics of the LV.
Eyeballing Ejection Fraction:
When qualitatively assessing LV function in PSAX, the EF can often be ‘eyeballed.’ From the circular ‘donut’ view at the mid-papillary level, a normal EF should look like the LV cavity volume is shrinking by more than half.
Figure 12: 2D PSAX demonstrating normal contractility and uniform wall motion
What is Not Normal
Decreased global function:
LVfx is considered reduced if the LV walls fail to contract effectively toward the center of the circular cavity during systole (figure 13).
RWMAs
RWMAs may be observed at any PSAX level (basal, mid or apical). One or more LV wall segments will fail to contract normally. Segments may appear hypokinetic, dyskinetic, akinetic or move paradoxically while surrounding segments contract normally. The LV segments may also be reduced in a global fashion.
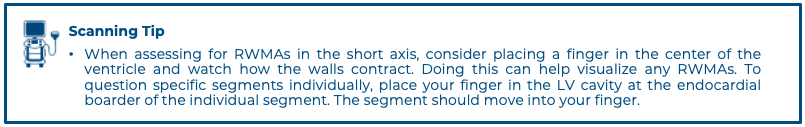
Figure 13: PSAX view demonstrating a dilated LV with reduced systolic function. Video courtesy of Dave Kirschner
Figure 14. PSAX mid papillary level exhibiting decreased function with hypokinesis of the lateral segment and akinesis of the posterior, inferior and septal segments. The anterior segment is not well seen in this clip. Note the pericardial effusion present laterally.
PSAX M-Mode
At the mid-papillary level, placing M-mode across the LV walls produces a motion trace of the septal and posterior walls throughout the cardiac cycle with distance displayed on the y-axis and time on the x-axis. The tracing shows the walls coming toward each other during systole and moving apart during diastole, with the LV cavity changing width in between (figure 15).
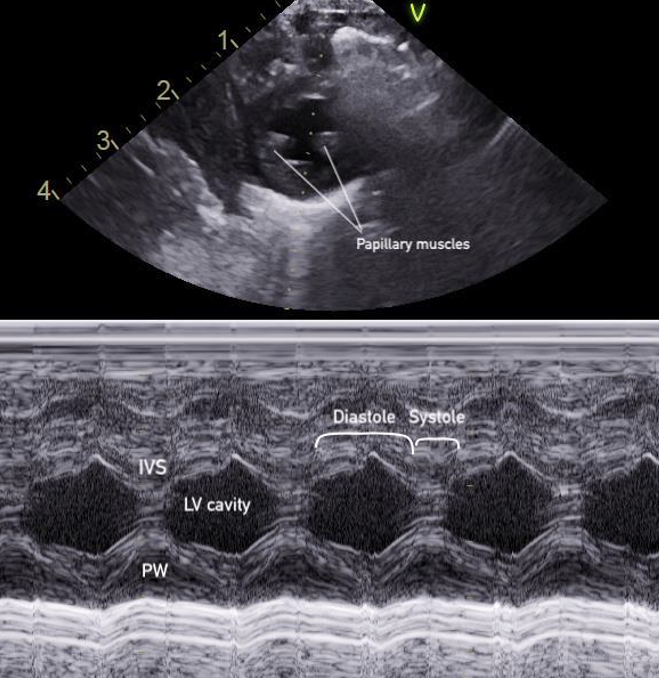 Figure 15: M-mode of the PSAX mid-papillary level
This pattern forms the basis for calculating fractional shortening (FS), which describes how much the LV diameter decreases during contraction, and linear EF, which measures volumetric change(figure 16). The FS and EF can be used to semi-quantify LVfx.
Measurements for FS and linear EF should be obtained at a single timepoint along the x axis corresponding to end-diastole and end-systole, rather than by selecting maximal wall excursion at different timepoints. Measuring the septum and posterior wall at different points of maximal excursion can result in inaccurate LV dimensions and overestimation of systolic function. It is also imperative to avoid placing the M-mode cursor through the papillary muscles, to ensure the true endocardial excursion is captured.
FS: percentage decrease in the LV diameter during contraction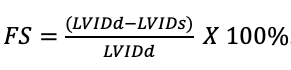
**Key Consideration**
FS assumes normal heart shape, absence of valvular pathology and normal global LV function without RWMAs. In the presence of arrhythmias (e.g. bundle branch blocks), RWMAs, variation in heart shape, or structural/valvular abnormalities (e.g., congenital heart disease, shunts), FS may not accurately reflect true LVFx. Even if FS appears normal, the heart may still fail to provide adequate forward systemic output.
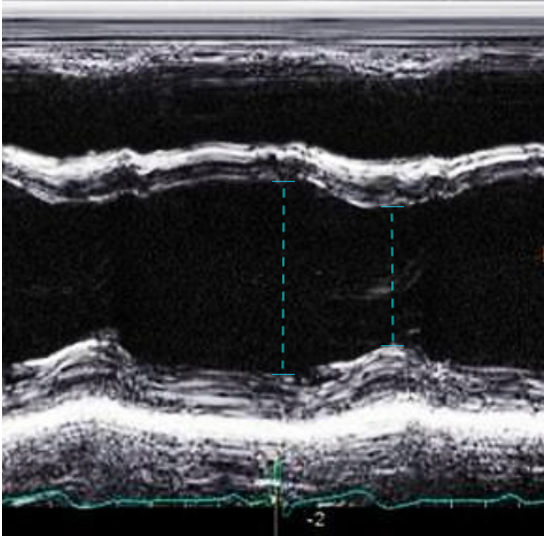 Figure 16. LVIDd and LVIDs caliper placement for FS/EF calculation in PSAX M-mode
PSAX M-Mode Technique
1. At the mid-papillary level, place the M-mode curser perpendicularly through the centre of the LV cavity, between the papillary muscles
2. Measure the FS if findings appear grossly abnormal, when a quantitative baseline is useful for follow-up or clinical reassessment, or consultation with cardiology is anticipated.
– Select the FS calculation package and measure the left ventricular internal diameter in diastole (LVIDd) and in systole (LVIDs)
3. Save the M-mode image, and include the measurement if performed.
Note: FS M-mode can also be done in the PLAX view, by placing the M-mode cursor just past the MV leaflet tips; however, it is simpler and preferred in the PSAX view due to better alignment of the M-mode cursor perpendicular to the LV walls, which ensures more accurate and reproducible measurements.
What is Normal & Not Normal
- Normal values for FS in infants and children are typically between 28% and 46% [18,22] (figure 17).
- A FS <28% is generally considered abnormal. This can be further categorized into mild, moderate and severe systolic dysfunction (table 3) [22] (Figure 18).
- In pediatrics, normal EF is ≥ 55% (figure 17)[23].
Table 3: Categorization of FS in Children
| 28-48% |
Normal |
| 20-25% |
Mild Dysfunction |
| 15-19% |
Moderate dysfunction |
| <14% |
Severe dysfunction |
Table 4: EF categorization [22]
| ≥ 55% |
Normal |
| 41-55% |
Mildly reduced |
| 31-40% |
Moderately reduced |
| ≤ 30% |
Severely reduced function |
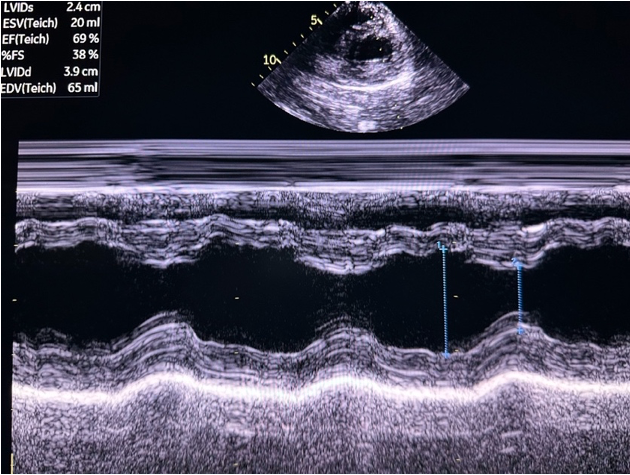 Figure 17. PSAX M-mode normal FS and EF
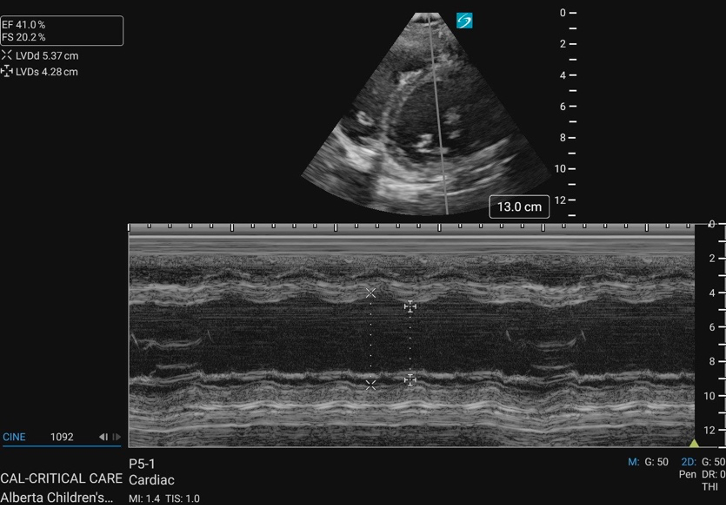 Figure 18. PSAX M-mode abnormal FS
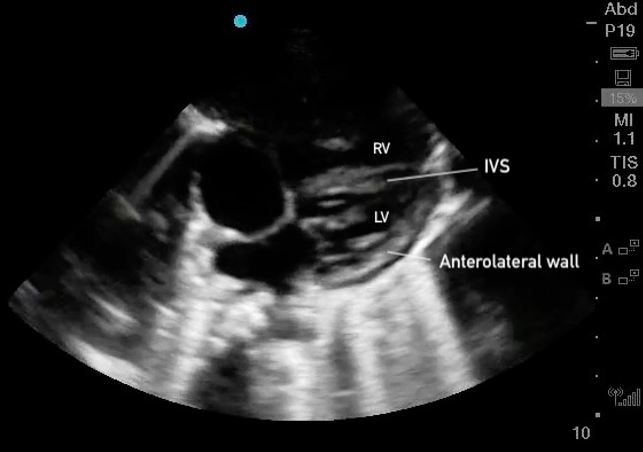 Figure 25. Subxiphoid 4 chamber with the LV walls labeled
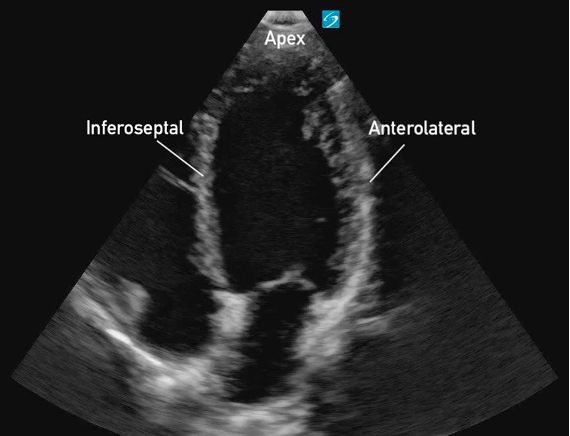 Figure 19: Apical 4 Chamber view in cardiology convention with the labeled left ventricular walls
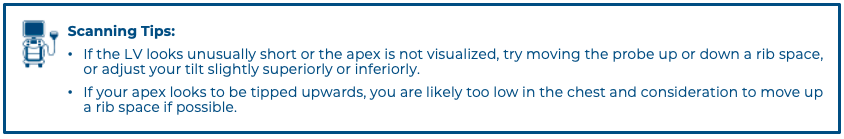
 Figure 3: Parasternal long axis view in cardiology convention anatomically labeled.
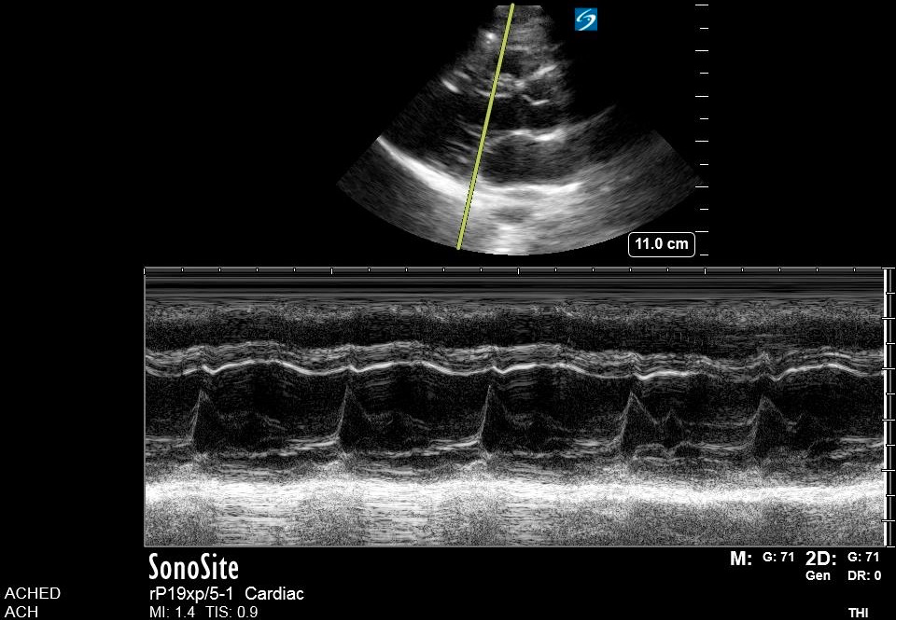 Figure 7. M-mode
 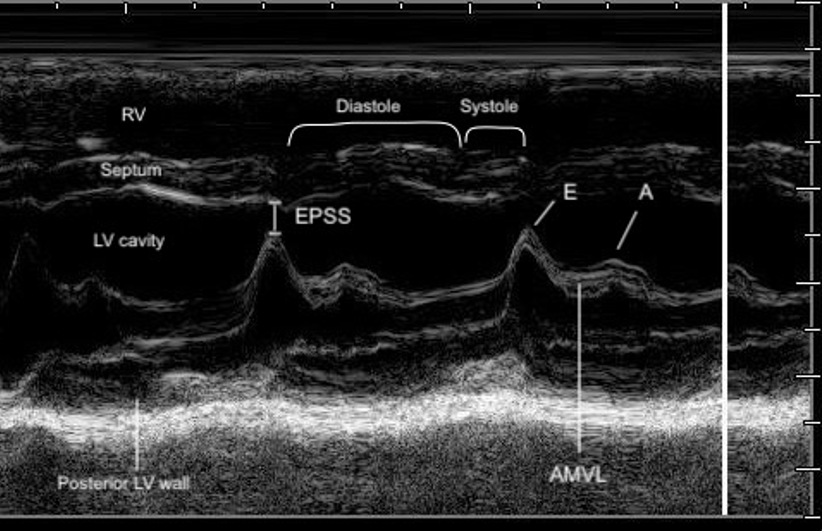 Figure 8. Zoomed-in view of the PLAX M-mode tracing at the level of the mitral valve tips.
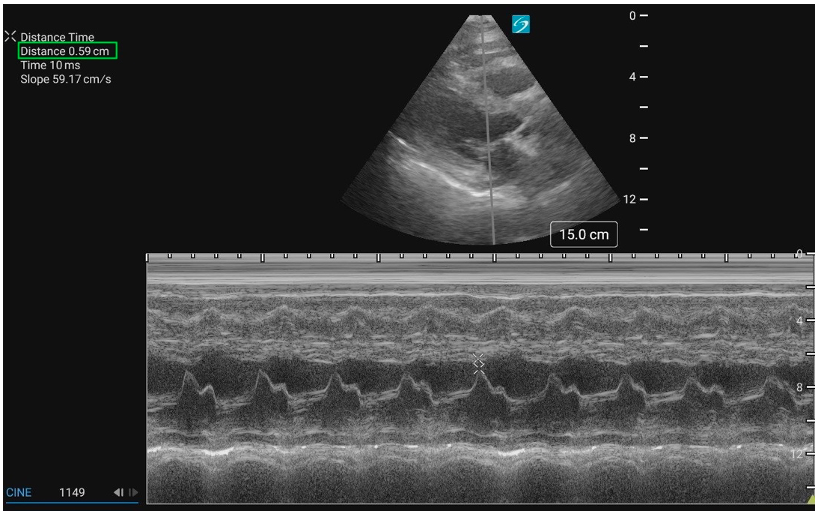 Figure 9: PLAX M-mode with normal EPSS measurement
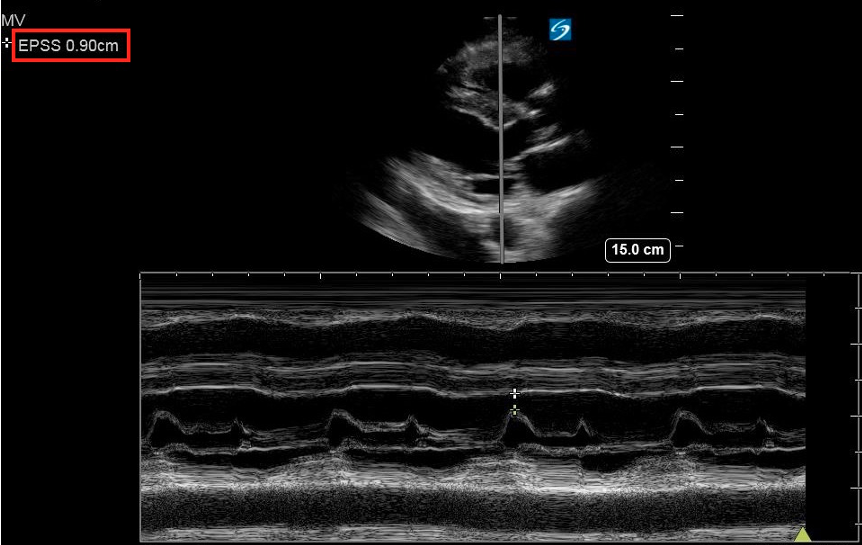 Figure 10: PLAX M-mode abnormal EPSS
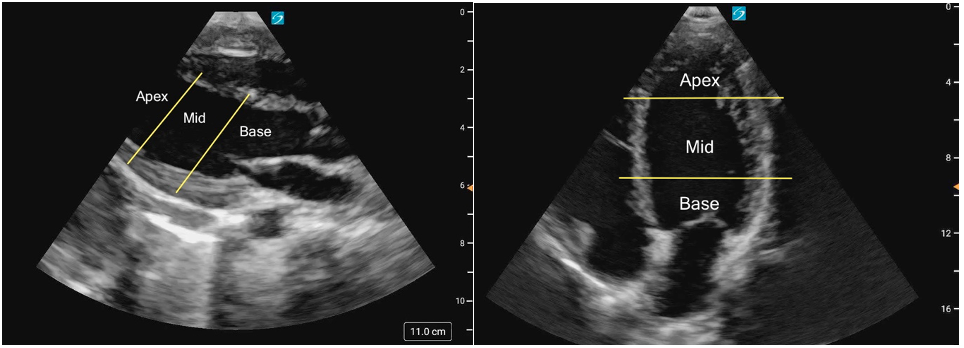 Figure 1ab: LV levels in the PLAX view (a) and A4C (b) in cardiology convention