Stepwise Technique Overview
Patient position: Supine
1. Assess point of maximal tenderness
2. Identify anatomical landmarks of the RLQ
3. Attempt left posterior oblique position to troubleshoot when having difficulty identifying the appendix
4. If a structure of interest is identified:
i. Short axis sweep: slide in short axis to review entire length from base to tip
ii. Long axis rotation: Rotate to view in long axis
– Try to visualize and capture the entire length of the appendix from the cecal junction to the tip
iii. Apply color doppler
– Select the color doppler function and set the color box over the area of interest, ensuring it is slightly larger to include surrounding tissue
– Use a low velocity scale and adjust the color gain to enhance sensitivity to flow.
iv. Assess compressibility
– In short axis, apply compression to assess compressibility
– Be sure to document the compressibility with a video clip or a buddy view (split-screen) showing images with and without probe compression.
v. Assess surround structures: look for secondary signs and document any findings
Point of maximal tenderness
This is the preferred starting point for appendicitis
1. Have the patient point with one finger to the spot that hurts the most
2. Place the probe in this spot, in the transverse position (probe marker toward patients right)
3. Review the immediate region in transverse and sagittal plane
** Tip: Identifying the point of maximal tenderness can require some coaching in smaller children
Anatomical Landmarks with identification of the cecum/ileocecal region
This technique used a systematic approach to identify first the anatomic landmarks in the immediate region of the appendix, then the cecum and ileocecal region.
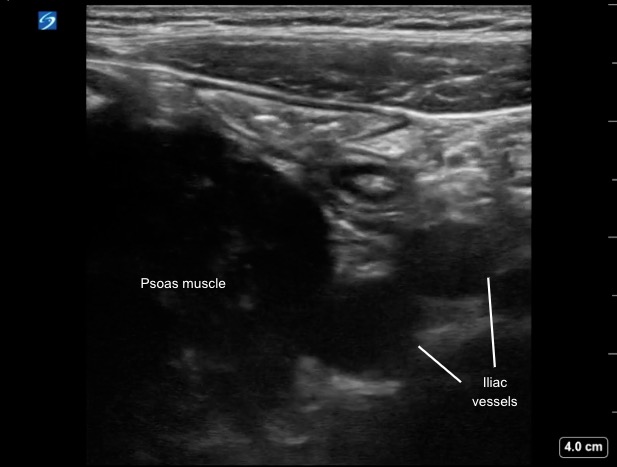
1. Place the probe in the transverse position in the right lower quadrant
2. Identify the iliac vessels and psoas muscle (Figure 2)
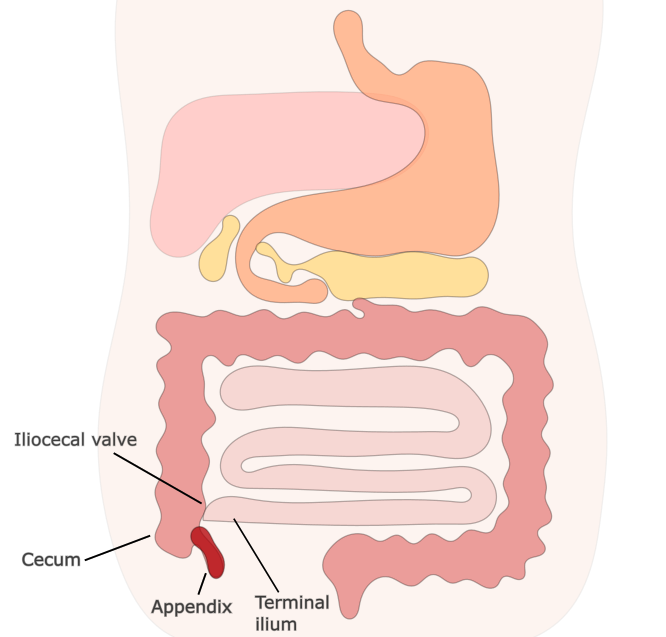
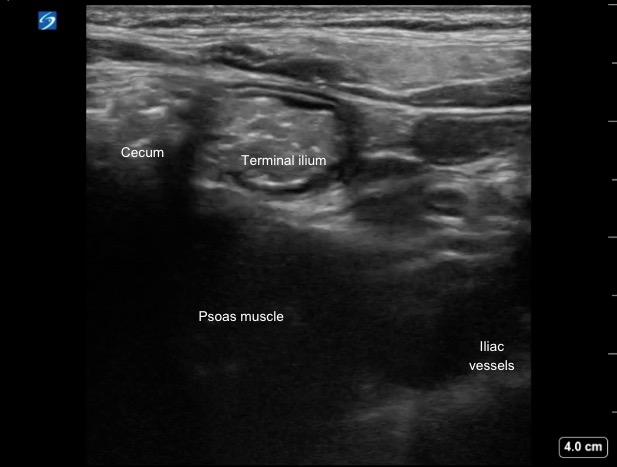
3. Look laterally (screen left) to identify the cecum (Figure 3)
4. Look for the origin of the terminal ilium posterior/medially from the cecum
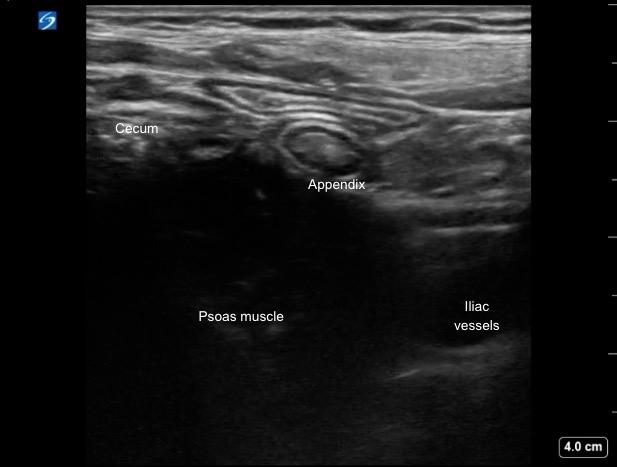
– The appendix typically arises posterior/medially from the cecum and caudal/posterior to the TI, draping anteriorly over the iliac vessels
5. Scan the area in transverse and sagittal planes until you can identify the appendix or any secondary findings