References

**To unlock access to the first quiz, make sure to select the “Mark as Completed” button below

References

  1. Patel, G et al. Point-of-Care Cardiac Ultrasound (POCCUS) in the Pediatric Emergency Department. Clinical Pediatric Emergency Medicine. 2018. 19: 323-327. DOI: 10.1016/j.cpem.2018.12.009
  2. Guevarra K, Greenstein Y. Ultrasonography in the Critical Care Unit. Curr Cardiol Rep. 2020;22(11):145. doi:10.1007/s11886-020-01393-z
  3. Volpicelli G, Lamorte A, Tullio M, et al. Point-of-care multiorgan ultrasonography for the evaluation of undifferentiated hypotension in the emergency department. Intensive Care Med. 2013;39(7):1290-1298. doi:10.1007/s00134-013-2919-7
  4. Potter SK, Griksaitis MJ. The role of point-of-care ultrasound in pediatric acute respiratory distress syndrome: emerging evidence for its use. Ann Transl Med. 2019;7(19):507-507. doi:10.21037/atm.2019.07.76
  5. Mojoli F, Bouhemad B, Mongodi S, Lichtenstein D. Lung Ultrasound for Critically Ill Patients. Am J Respir Crit Care Med. 2019;199(6):701-714. doi:10.1164/rccm.201802-0236CI
  6. Longjohn M, Wan J. Point-of-Care Echocardiography by Pediatric Emergency Physicians. Pediatric Emergency Care. 2011;27(8).
  7. Miller AF, Arichai P, Gravel CA, et al. Use of Cardiac Point-of-Care Ultrasound in the Pediatric Emergency Department. Pediatr Emer Care. 2022;38(1):e300-e305. doi:1097/pec.0000000000002271
  8. Riera A, Weeks B, Emerson BL, Chen L. Evaluation of a Focused Cardiac Ultrasound Protocol in a Pediatric Emergency Department. Pediatr Emer Care. 2021;37(4):191-198. doi:1097/pec.0000000000001495
  9. Spurney CF, Sable CA, Berger JT, Martin GR. Use of a hand-carried ultrasound device by critical care physicians for the diagnosis of pericardial effusions, decreased cardiac function, and left ventricular enlargement in pediatric patients. Journal of the American Society of Echocardiography. 2005;18(4):313-319. doi:1016/j.echo.2004.10.016
  10. Conlon TW, Himebauch AS, Fitzgerald JC, et al. Implementation of a Pediatric Critical Care Focused Bedside Ultrasound Training Program in a Large Academic PICU*. Pediatric Critical Care Medicine. 2015;16(3):219-226. doi:1097/pcc.0000000000000340
  11. Moore CL, Rose GA, Tayal VS, Sullivan DM, Arrowood JA, Kline JA. Determination of Left Ventricular Function by Emergency Physician Echocardiography of Hypotensive Patients. Academic Emergency Medicine. 2002;9(3):186-193. doi:1197/aemj.9.3.186
  12. Vorel ES, Jacquemyn X, Cohen JS, Kutty S, Deanehan JK. Pediatric Reference Ranges and Test Characteristics of E-point Septal Separation as a Marker for Left Ventricular Dysfunction: A Retrospective Study. Pediatric Emergency Care. Published online April 14, 2025. doi:1097/pec.0000000000003393
  13. Griffee MJ, Merkel MJ, Wei KS. The role of echocardiography in hemodynamic assessment of septic shock. Crit Care Clin. 2010;26(2):365-382, table of contents. doi:10.1016/j.ccc.2010.01.001
  14. Watkins LA, Dial SP, Koenig SJ, Kurepa DN, Mayo PH. The Utility of Point-of-Care Ultrasound in the Pediatric Intensive Care Unit. J Intensive Care Med. Published online October 9, 2021:088506662110478. doi:10.1177/08850666211047824
  15. Gaspar HA, Morhy SS. The Role of Focused Echocardiography in Pediatric Intensive Care: A Critical Appraisal. BioMed Research International. 2015;2015:1-7. doi:10.1155/2015/596451 de Boode WP, van der Lee R, et al. The role of Neonatologist Performed Echocardiography in the assessment and management of neonatal shock. Pediatr Res. 2018;84(S1):57-67. doi:10.1038/s41390-018-0081-1
  16. Arnoldi S, Glau CL, Walker SB, et al. Integrating Focused Cardiac Ultrasound Into Pediatric Septic Shock Assessment*. Pediatric Critical Care Medicine. 2021;22(3):262-274. doi:10.1097/PCC.0000000000002658
  17. Ranjit S, Aram G, Kissoon N, et al. Multimodal Monitoring for Hemodynamic Categorization and Management of Pediatric Septic Shock: A Pilot Observational Study*. Pediatric Critical Care Medicine. 2014;15(1):e17-e26. doi:10.1097/PCC.0b013e3182a5589c
  18. Singh Y, Tissot C, Fraga MV, et al. International evidence-based guidelines on Point of Care Ultrasound (POCUS) for critically ill neonates and children issued by the POCUS Working Group of the European Society of Paediatric and Neonatal Intensive Care (ESPNIC). Crit Care. 2020;24(1):65. doi:10.1186/s13054-020-2787-9
  19. Lu JC, Riley A, Conlon T, et al. Recommendations for Cardiac Point-of-Care Ultrasound in Children: A Report from the American Society of Echocardiography. Journal of the American Society of Echocardiography. 2023;36(3):265-277. doi:1016/j.echo.2022.11.010 1.
  20. Sengupta PP, Tajik AJ, Chandrasekaran K, Khandheria BK. Twist Mechanics of the Left Ventricle. JACC: Cardiovascular Imaging. 2008;1(3):366-376. doi:1016/j.jcmg.2008.02.006
  21. Engle SJ, DiSessa TG, Perloff JK, et al. Mitral valve E point to ventricular septal separation in infants and children. The American Journal of Cardiology. 1983;52(8):1084-1087. doi:1016/0002-9149(83)90537-4
  22. Tissot C, Singh Y, Sekarski N. Echocardiographic Evaluation of Ventricular Function—For the Neonatologist and Pediatric Intensivist. Front Pediatr. 2018;6. doi:3389/fped.2018.00079
  23. Margossian R, Schwartz ML, Prakash A, Wruck L, Colan SD, Atz AM, et al. Comparison of echocardiographic and cardiac magnetic resonance imaging measurements of functional single ventricular volumes, mass, and ejection fraction (from the Pediatric Heart Network Fontan CrossSectional Study). Am J Cardiol (2009) 104(3):419–28. doi:10.1016/j. amjcard.2009.03.058 1.
  24. Muniz RT, Mesquita ET, Souza Junior CV, Martins WDA. Pulmonary Ultrasound in Patients with Heart Failure – Systematic Review. Arquivos Brasileiros de Cardiologia. Published online 2018. doi:5935/abc.20180097
  25. van Royen N, Jaffe C, Krumholz H, Johnson K, Lynch P, Natale D, Atkinson P, Deman P, Wackers F. Comparison and Reproducibility of Visual Echocardiographic and Quantitative Radionuclide Left Ventricular Ejection Fractions. American Journal of Cardiology. 1996;77.

Summary

Summary

  • PoCUS is a rapid and focused tool for assessing cardiac function, offering more timely insights than the physical exam alone and providing useful preliminary information to guide further cardiology evaluation and management.
  • PoCUS should be used as a rule-in tool, not a rule-out test, especially when clinical suspicion for LV dysfunction is high. A normal or unclear PoCUS exam does not exclude pathology and should not replace formal imaging when concern persists
  • Multiple views = more confidence. Always assess LV systolic function from the standard windows (PLAX, PSAX, A4C, and subxiphoid 4-chamber) to ensure consistency and accuracy.
  • An EPSS ≤ 7 mm is generally considered within normal limits, though values should always be interpreted in context and with consideration of the clinical picture.
  • Be mindful of the limitations, both technical (e.g., foreshortening, off-axis views, poor acoustic windows) and interpretive (e.g., variability in qualitative and quantitative measures).

Pitfalls and Limitations

Pitfalls & Limitations

A common limitation when assessing cardiac function is foreshortening of the ventricle, particularly in the PLAX and A4C views (Figure 28,29). Foreshortening occurs when the imaging plane cuts through the heart at an angle that misses the true apex, making the LV appear shorter and more rounded than it actually is. This leads to underestimation of LV size, overestimation of LVfx and poor visualization of true wall motion. To minimize this, adjust your probe position, often one intercostal space lower, if you notice a truncated LV. That said, in some patients, a foreshortened view may be the only achievable window due to body habitus, lung interference, or cooperation. In such cases, it is essential to recognize the limitation and interpret findings with caution. This is why the heart should always be imaged in as many views as possible.

Figure 28: Comparison of PLAX foreshortened VS not foreshortened.


Figure 29: Comparison of A4C foreshortened VS not foreshortened


PoCUS relies primarily on qualitative assessment of LV systolic function. While visual evaluation and “eyeballing” EF is a valuable and necessary skill, it is inherently subjective and can vary significantly between users. Studies have shown that qualitative assessment alone can miss borderline or mild systolic dysfunction [7, 25]. Beginners may find it especially challenging. Comparing PoCUS impressions to formal echocardiography reports is a practical way to increase accuracy and build clinical confidence over time.

EPSS can be a helpful quantitative supplement, but it has important limitations. Obtaining an accurate EPSS measurement can be technically challenging, particularly in pediatric patients as it requires placing the M-mode cursor through the tip of the AMVL. Errors in positioning can lead to inaccurate measurements. It is also important to reiterate that EPSS should never be used as a single measure of LV systolic function. EPSS should be interpreted only in conjunction with other functional assessments

Additionally, EPSS is unreliable in the presence of mitral valve pathology, aortic regurgitation, LV dilation and IVS motion abnormality/arrythmia. Structural abnormalities or altered leaflet motion can distort EPSS measurements and reduce their reliability for assessing systolic function. In these cases, the EPSS should not be used. EPSS alone is insufficient to guide decisions regarding cardiology referral or formal echocardiography without corroborating functional findings.

More generally, if significant structural, valvular, or electric dysfunction is present, PoCUS 2D assessment of LVfx may also be unreliable. When blood is not flowing normally, the usual 2D indicators, such as wall thickening or change in chamber size, can appear preserved even though effective stroke volume is reduced and may provide false reassurance about systolic function.

FS and EF can also provide helpful quantitative data, but it is important remember that these linear dimensions rely on key assumptions. When these conditions are not met, FS and EF derived from M-mode may not accurately reflect true LVfx. Moreover, because EF calculations involve cubing linear dimensions, they are more sensitive to variations in heart size and shape than FS. Therefore, these measurements should always be interpreted in the context of the overall clinical and imaging picture.

Arrhythmias also limit the accuracy of PoCUS assessments [7]. Bradycardia can make interpretation of LV systolic function challenging, as slow contractions may mimic systolic dysfunction or give the appearance of hypokinesis of the LV walls. Conversely, tachycardia can make it difficult to accurately assess function and wall motion due to reduced filling time and motion blur and may also create the illusion of hyperdynamic function. In cases of tachycardia it is important to focus on the ventricular wall motion and not the speed of contraction, and consider slowing the clip playback to assess function more accurately. Other arrhythmias with variable heart rates, such as bundle branch blocks, fibrillation, and frequent ectopy can complicate both qualitative and quantitative evaluation by causing beat-to-beat variability in ventricular filling and contraction, making both visual interpretation and consistent measurements difficult to obtain.


Figure 30. PLAX(a) and PSAX(b) views in a child with tachycardiac mimicking hyperdynamic function.


Figure 31. PLAX view demonstrating beat-to-beat variation in LV filling due to frequent premature ventricular contractions, illustrating the challenge of visual interpretation of LVfx in presence of arrythmias.


As with all cardiac ultrasound, patient factors can significantly affect image quality. Lung interference (figure 32), body habitus, and poor cooperation (especially in children) may limit visualization. Try multiple child positions (e.g., supine, left lateral decubitus) and use caregiver involvement, such as having the child sit in a parent’s arms, to increase comfort and cooperation. Utilize the most accessible windows, such as subcostal views, if other views are limited.

Figure 32. PLAX view with lung interference


Finally, formal echocardiography should be pursued when image quality is suboptimal, interpretation is uncertain, or there are clinical concerns for cardiac dysfunction or injury, even if PoCUS findings appear normal [19].

Lung PoCUS and LV Function


In addition to the cardiac windows, lung ultrasound (LUS) can also provide valuable indirect information about LV performance. LUS is highly sensitive to detect early or subtle increases in left ventricular end diastolic filling pressures (LVEDP) [24].

In the setting of LV systolic dysfunction or congestive heart failure, elevated LVEDP leads to pulmonary congestion, which manifests on LUS as the progressive appearance of B-lines. B-lines occur as the edema or excess extravascular lung water interact with air-filled alveoli to create a reverberation artifact. The distribution and severity of B-lines correlate with the degree of pulmonary interstitial edema or fluid overload and, by extension, can reflect deterioration in LVfx.

Integrating LUS findings with cardiac PoCUS can provide a more comprehensive assessment of LVfx.


For details on performing and interpreting LUS in the context of heart failure and pulmonary congestion, please refer to the dedicated KidSONO Interstitial Disease module

Subcostal Four Chamber

What am I Looking at?

The subxiphoid 4 Chamber view can be used to assess ventricular function, particularly during emergent situations, when access to the other windows is limited.

The left ventricle is seen in the far field with the septal and lateral walls in view. The RV is seen more anteriorly.


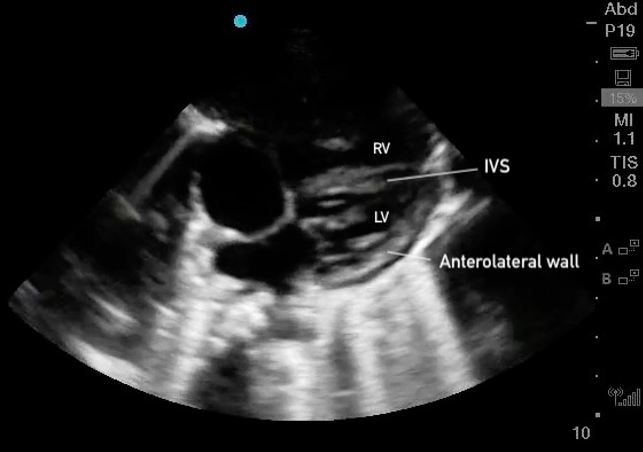
Figure 25. Subxiphoid 4 chamber with the LV walls labeled

What is Normal

Contractility:

All visible LV walls should demonstrate symmetric inward motion and thickening, moving toward the center of the ventricle in a coordinated fashion.

Figure 26. Subxiphoid 4 chamber view with normal LV function


What is NOT Normal

Decreased global function:

The LV walls will fail to contract effectively toward the center of the cavity during systole. Wall motion appears sluggish or diminished, and the overall inward movement and thickening are reduced (figure 27).

Figure 27: Subxiphoid 4 Chamber demonstrating reduced LV systolic function. Video courtesy of Dave Kirschner

Apical Four Chamber

What am I Looking at?

In A4C view, you can assess LV wall motion at the basal, mid, and apical levels of the inferoseptal and anterolateral walls (figure 19). This view is also useful for visual estimation of overall contractility and evaluation of the LV’s size and shape throughout systole and diastole.

It is important to avoid foreshortening in the A4C view, as this can underestimate LV length and overestimate function. If the LV appears round or blunt at the apex, the image is likely foreshortened—slide the probe laterally and slightly inferiorly to better align with the cardiac apex, and angle it more anteriorly (toward the face) to bring the true apex into view and ensure a full-length chamber.

Formal echocardiography uses apical views to calculate EF using Simpson’s biplane methods; however, this is beyond the scope of PoCUS practice


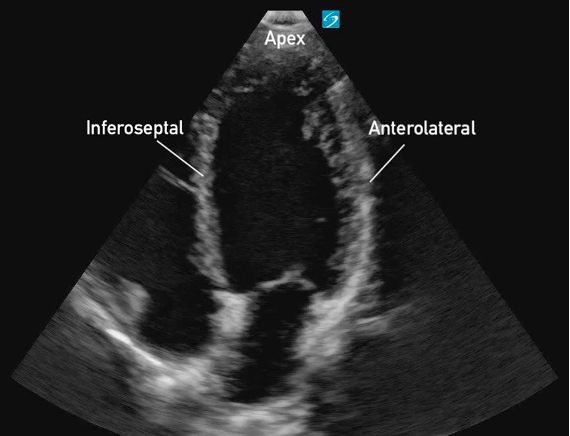
Figure 19: Apical 4 Chamber view in cardiology convention with the labeled left ventricular walls


What is Normal

Contractility:

The apex and visible LV walls (inferoseptal and anterolateral) should move inward toward the center, with the base also moving toward the apex. All walls should demonstrate coordinated inward motion and uniform thickening.

Eyeballing Ejection Fraction:

When qualitatively assessing LV function in the A4C view, the EF can often be ‘eyeballed’. The LV cavity should visibly reduce its volume by more than half with each contraction. Longitudinal shortening will also contribute to overall cavity reduction.

Figure 20: A4C demonstrating adequate contractility despite poor window


Figure 21. A4C demonstrating adequate contractility and clear wall thickening


What is NOT Normal

Decreased global function:

LVfx is considered reduced if the visible walls fail to contract effectively toward the center of the cavity during systole. Wall motion appears sluggish or diminished, and the overall inward movement and thickening are reduced.


Figure 22. A4C view in a child with severe, globally reduced systolic function


RWMAs:

RWMAs may be observed in the inferoseptal wall, anterolateral wall, or apex, with segments showing hypokinesis, paradoxical motion, dyskinesis or akinesis while other segments contract normally (figure 23). The segments may also be reduced in a global fashion.

Figure 23: A4C view demonstrating moderately reduced LF systolic function and RWMAs of the inferoseptal and anterolateral walls.


Hyperdynamic function:

The inferoseptal and anterolateral walls may nearly or completely touch during systole, leading to near obliteration of the ventricular cavity (figure 24). This effect is often more pronounced at the apex, while the basal segments may not completely obliterate.

Figure 24. A4C view demonstrating hyperdynamic LV systolic function.

Parasternal Short Axis

What am I Looking at?

The PSAX view provides a cross-sectional image of the LV, allowing simultaneous visualization of multiple walls. It is the preferred view for global assessment of LVfx and RWMAs. This view is useful for assessing wall motion across the anterior, lateral, posterior, inferior, and septal segments, all seen in a single plane at multiple levels (basal, mid, apical) (figure 11).

A circular LV cavity indicates you’re on-axis, while an oval or elliptical shape suggests you’re off-axis and should adjust your probe angle for a true short-axis view.


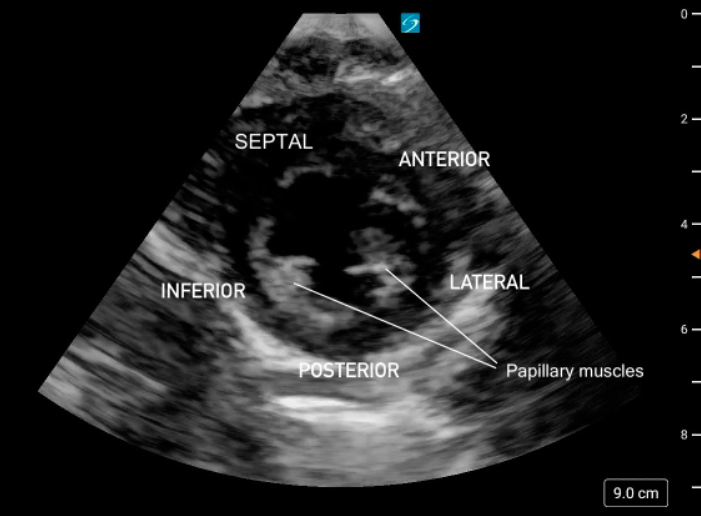
Figure 11. PSAX at the mid-papillary level with left ventricular walls labeled.


What is Normal

Contractility:

At each PSAX level, all LV walls should contract symmetrically, moving inward toward the center of the circular cavity and thickening evenly during systole. All walls should demonstrate coordinated inward motion and uniform thickening.

At the apical level, you may also notice a subtle twisting or rotational motion during systole, reflecting the normal torsional mechanics of the LV.


Eyeballing Ejection Fraction:

When qualitatively assessing LV function in PSAX, the EF can often be ‘eyeballed.’ From the circular ‘donut’ view at the mid-papillary level, a normal EF should look like the LV cavity volume is shrinking by more than half.


Figure 12: 2D PSAX demonstrating normal contractility and uniform wall motion


What is Not Normal

Decreased global function:

LVfx is considered reduced if the LV walls fail to contract effectively toward the center of the circular cavity during systole (figure 13).


RWMAs 

RWMAs may be observed at any PSAX level (basal, mid or apical). One or more LV wall segments will fail to contract normally.  Segments may appear hypokinetic, dyskinetic, akinetic or move paradoxically while surrounding segments contract normally. The LV segments may also be reduced in a global fashion.


Figure 13: PSAX view demonstrating a dilated LV with reduced systolic function. Video courtesy of Dave Kirschner

Figure 14. PSAX mid papillary level exhibiting decreased function with hypokinesis of the lateral segment and akinesis of the posterior, inferior and septal segments. The anterior segment is not well seen in this clip. Note the pericardial effusion present laterally.


PSAX M-Mode

At the mid-papillary level, placing M-mode across the LV walls produces a motion trace of the septal and posterior walls throughout the cardiac cycle with distance displayed on the y-axis and time on the x-axis. The tracing shows the walls coming toward each other during systole and moving apart during diastole, with the LV cavity changing width in between (figure 15).


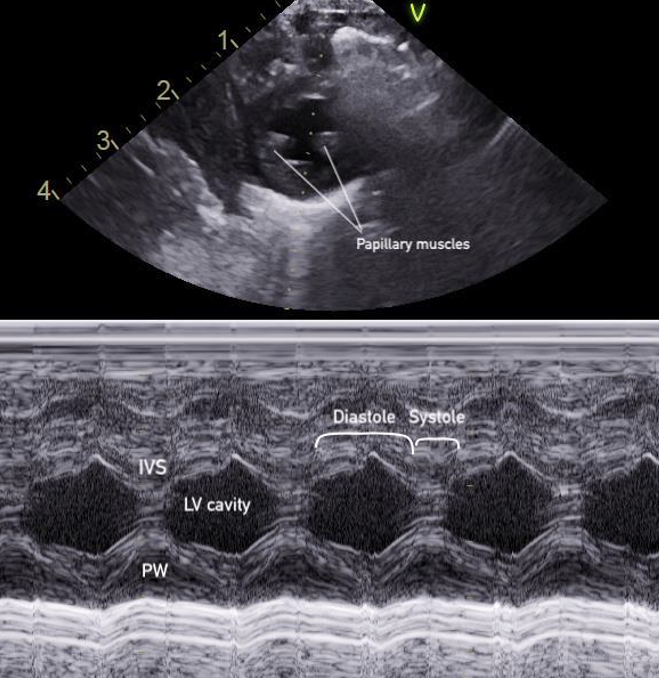
Figure 15: M-mode of the PSAX mid-papillary level


This pattern forms the basis for calculating fractional shortening (FS), which describes how much the LV diameter decreases during contraction, and linear EF, which measures volumetric change(figure 16). The FS and EF can be used to semi-quantify LVfx.

Measurements for FS and linear EF should be obtained at a single timepoint along the x axis corresponding to end-diastole and end-systole, rather than by selecting maximal wall excursion at different timepoints. Measuring the septum and posterior wall at different points of maximal excursion can result in inaccurate LV dimensions and overestimation of systolic function. It is also imperative to avoid placing the M-mode cursor through the papillary muscles, to ensure the true endocardial excursion is captured.


FS: percentage decrease in the LV diameter during contraction


**Key Consideration**
FS assumes normal heart shape, absence of valvular pathology and normal global LV function without RWMAs. In the presence of arrhythmias (e.g. bundle branch blocks), RWMAs, variation in heart shape, or structural/valvular abnormalities (e.g., congenital heart disease, shunts), FS may not accurately reflect true LVFx.  Even if FS appears normal, the heart may still fail to provide adequate forward systemic output.


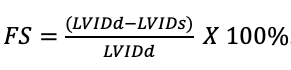
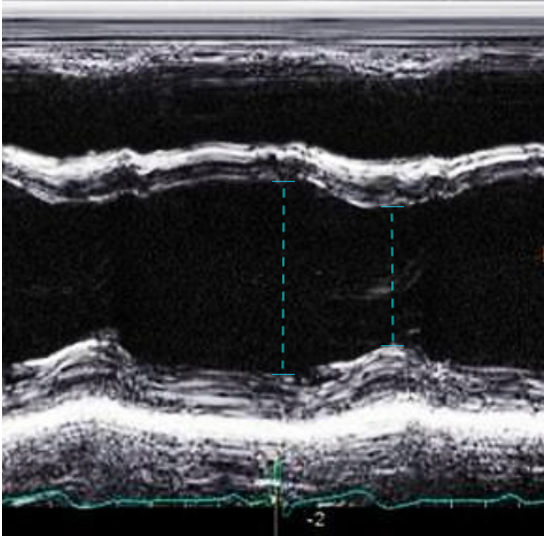
Figure 16. LVIDd and LVIDs caliper placement for FS/EF calculation in PSAX M-mode


PSAX M-Mode Technique

1. At the mid-papillary level, place the M-mode curser perpendicularly through the centre of the LV cavity, between the papillary muscles
2. Measure the FS if findings appear grossly abnormal, when a quantitative baseline is useful for follow-up or clinical reassessment, or consultation with cardiology is anticipated.

– Select the FS calculation package and measure the left ventricular internal diameter in diastole (LVIDd) and in systole (LVIDs)

3. Save the M-mode image, and include the measurement if performed.


Note: FS M-mode can also be done in the PLAX view, by placing the M-mode cursor just past the MV leaflet tips; however, it is simpler and preferred in the PSAX view due to better alignment of the M-mode cursor perpendicular to the LV walls, which ensures more accurate and reproducible measurements.


What is Normal & Not Normal

  • Normal values for FS in infants and children are typically between 28% and 46% [18,22] (figure 17).
  • A FS <28% is generally considered abnormal. This can be further categorized into mild, moderate and severe systolic dysfunction (table 3) [22] (Figure 18).
  • In pediatrics, normal EF is ≥ 55% (figure 17)[23].


Table 3: Categorization of FS in Children

28-48% Normal
20-25% Mild Dysfunction
15-19% Moderate dysfunction
<14% Severe dysfunction


Table 4: EF categorization [22]

≥ 55% Normal
41-55% Mildly reduced
31-40% Moderately reduced
≤ 30% Severely reduced function


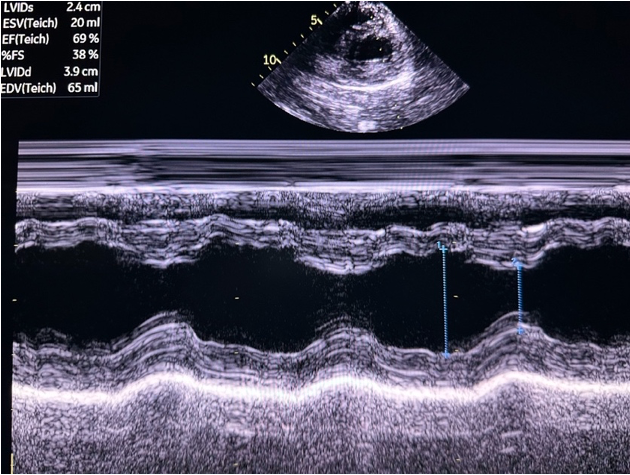
Figure 17. PSAX M-mode normal FS and EF


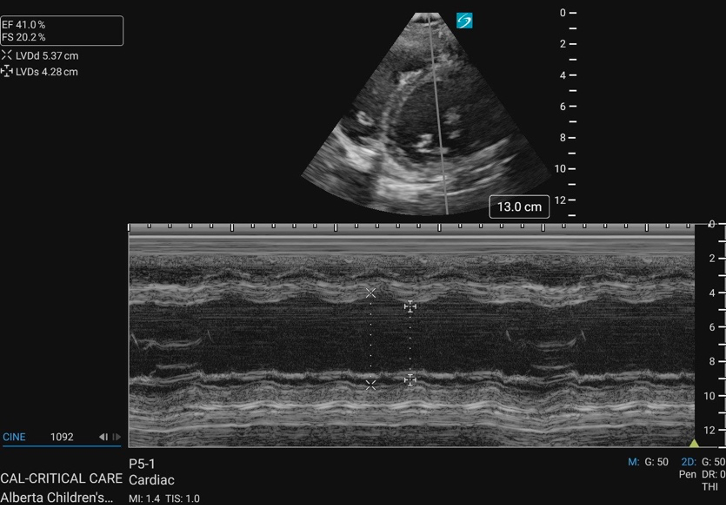
Figure 18. PSAX M-mode abnormal FS

Parasternal Long Axis

What am I Looking at?

In the PLAX view, we see the interventricular septum (IVS), LV cavity, and the posterior wall of the LV (Figure 3). You should see the mitral valve, LV outflow tract, and AOV in one continuous plane. Most often, you will not see the distal ventricle/apex in the same window as your AOV/MV.

Foreshortening is a common limitation to the PLAX view, and recognizing when you are foreshortened is important to avoid overestimating systolic function. Signs of foreshortening include a LV cavity that seems unusually short and truncated, rather than elongated (figure 4). Remember to ensure that you have the AMVL as well as the point of coaptation of the AOV cusps clearly visible in the same plane and the ventricle looks elongated an bullet shaped as this will ensure that you are in the true long-axis position and will avoid the risk of foreshortening.


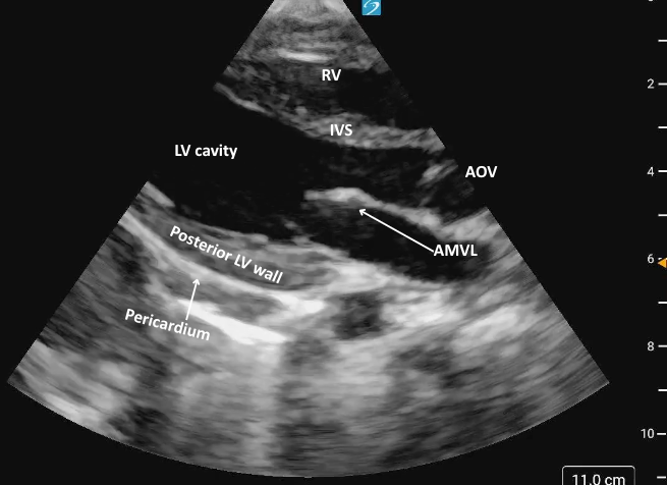
Figure 3: Parasternal long axis view in cardiology convention anatomically labeled.
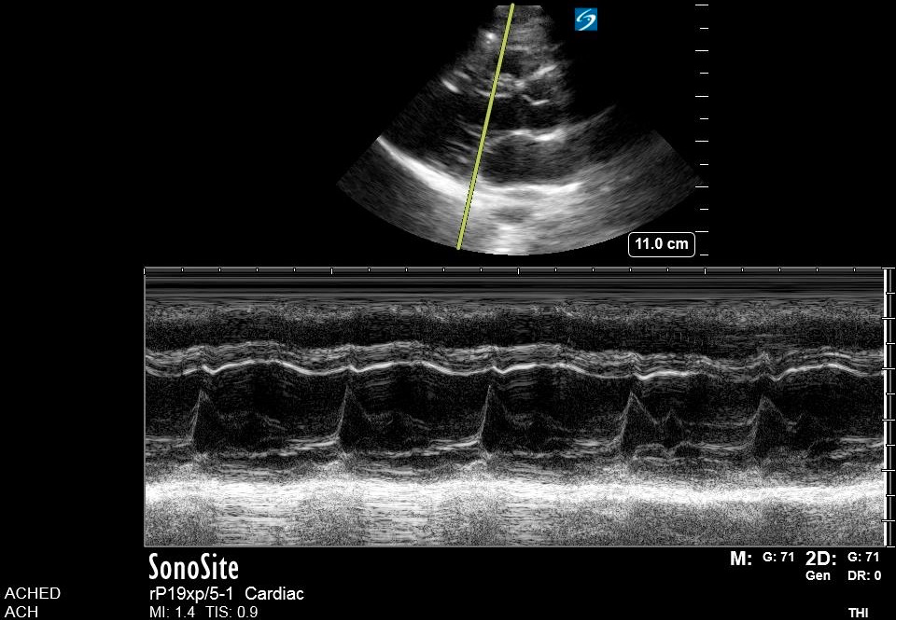
 

Figure 4ab: Comparison of PLAX foreshortened (a) VS not foreshortened (b)


What is Normal


Contractility:

The IVS and posterior LV wall should both thicken and move inward toward each other during systole, with coordinated and symmetric motion.

AMVL motion:

When the AMVL nearly contacts the IVS during diastole, it is generally indicative of normal LV systolic function. The closer the leaflet comes to the septum, the better the presumed function.


**Key Consideration: Assessing LV function based on AMVL motion assumes a structurally and functionally normal mitral valve and absence of other pathology such as aortic regurgitation, LV dilation, and IVS motion abnormality/arrythmia. In the presence of such pathology, this method is an unreliable correlate of LV systolic function.


Figure 5: 2D PLAX demonstrating normal contractility and function with minimal distance between the AMVL and IVS during diastole.


What is NOT Normal

Decreased global function:

If the IVS and the posterior LV wall fail to move effectively toward each other during systole it suggests reduced LVfx. Wall motion may appear sluggish, and thickening may be diminished.

AMVL motion

If the AMVL does not move close to the IVS, but rather creates a visibly large gap, this could suggest reduced systolic function (figure 6).


Figure 6: 2D PLAX view demonstrating markedly reduced LV systolic function, evidenced by poor inward motion of the LV walls during systole and a large gap between the IVS and AMVL.


PLAX M-Mode

In the PLAX view, M-mode is commonly used to assess LVfx by placing the cursor perpendicular to the IVS and posterior wall at the level of the MV tips. This provides a time-motion trace of LV wall motion and cavity size throughout the cardiac cycle, with distance displayed on the y-axis and time on the x-axis allowing evaluation of systolic function.

You’ll see a wave-like motion tracing of the MV leaflets movement across the cardiac cycle. In early diastole, the AMVL rapidly opens toward the IVS, creating the tall E-wave, followed by a smaller A-wave from atrial contraction (figure 7,8).


Figure 7. M-mode


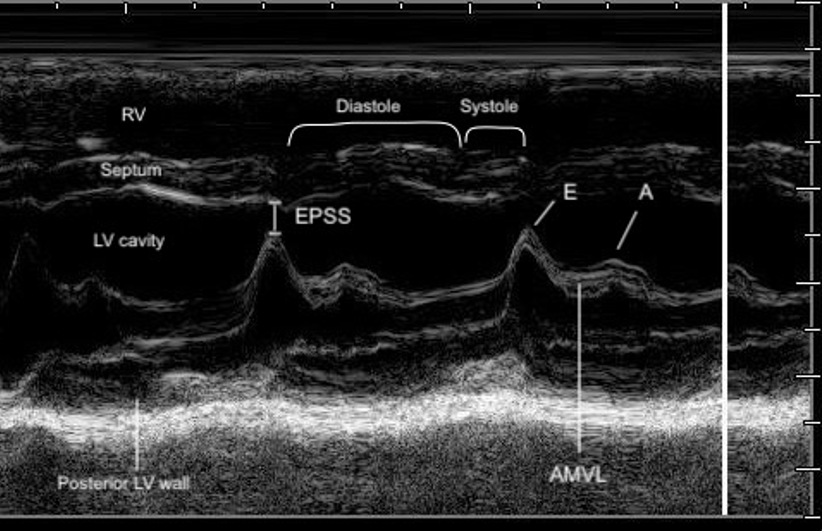
Figure 8. Zoomed-in view of the PLAX M-mode tracing at the level of the mitral valve tips.


End Point Septal Separation

The EPSS is a measure of AMVL motion and is used as a way to semi-quantify LVfx. It refers to the minimal distance between the peak of the E-wave and the IVS at the same X-axis time point (figure 8).

Technique – EPSS
1. Activate M-mode and place the cursor line through the tip of the AMVL and the septum.
2. Measure EPSS if findings appear grossly abnormal, when a semi-quantitative baseline is useful for follow-up or clinical reassessment, or consultation with cardiology is anticipated.

· The EPSS is measured at the minimum distance between the AMVL and the septum in early diastole.

3. Save the M-mode image, and include the measurement if performed.


In a normally functioning LV, the E-point comes close to the septum (figure 9).  In pediatric patients, there is limited validated evidence for normal EPSS values. A 1983 study provided guidelines for the use of EPSS in infants and children and found that normal EPSS was ≤ to 6mm, with 7-8mm being tail end of normal [21]. This was confirmed in a more recent study where an EPSS of 6.17 mm optimally distinguished normal from depressed LV systolic function, with a sensitivity of 86% and specificity of 92% [12].

The larger the EPSS distance the worse the function. Similar to the AMVL visual assessment, if the E-point is not close to the IVS during the M-mode tracing, this could suggest reduced systolic function. Specific cutoff values are available to guide interpretation (table 3) (Figure 10).

Table 2: EPSS value ranges for pediatric populations [12,21]

≤7mm Normal
≥ 8 Reduced function


Key Consideration: The EPSS should never be used as a single measure of LV systolic function as it can be influenced by many factors such as valvular dysfunction in mitral stenosis or aortic insufficiency. EPSS should always be considered in a larger evaluation of LV function including visual assessment of LV contractility. EPSS alone is insufficient to guide decisions regarding cardiology referral or formal echocardiography without corroborating functional findings.


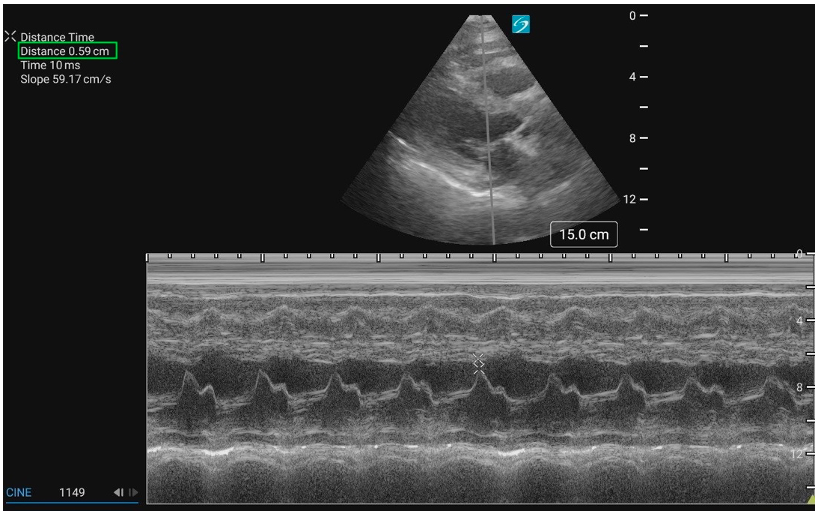
Figure 9: PLAX M-mode with normal EPSS measurement


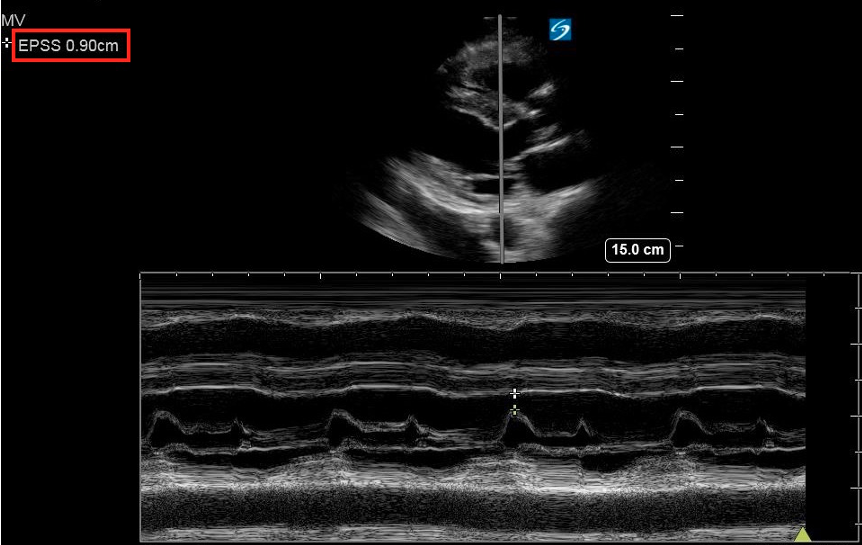
Figure 10: PLAX M-mode abnormal EPSS

What am I Looking at?


Each cardiac view offers a different perspective of the LV, displaying various walls and myocardial segments. The LV is typically divided into three levels: basal, mid, and apical. The basal segments are located closest to the atrioventricular valves and represent the upper portion of the LV; the mid segments are situated in the middle, at or around the level of the papillary muscles, and the apical segments are near the apex of the ventricle. Understanding which walls are visualized in each view is key to assessing LVfx.

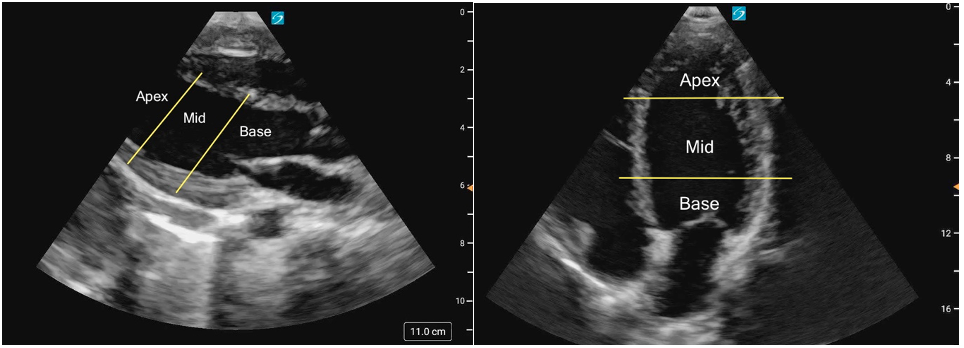
Figure 1ab: LV levels in the PLAX view (a) and A4C (b) in cardiology convention


At a Glance: Normal VS Not Normal

The findings below outline the broad features of what is considered normal and not normal for pediatric LVfx; the specifics for each individual view will be described in the following sections.


What is Normal

Contractility:

The contraction of the LV occurs in a complex but coordinated manner, combining longitudinal shortening, radial thickening, and circumferential constriction [20]. The base of the heart moves toward the apex as the ventricle shortens, while the cavity simultaneously decreases in diameter due to inward wall motion. This multidirectional contraction pattern efficiently ejects blood into the aorta and gives the ventricle its characteristic torsional motion, where the apex rotates slightly counterclockwise and the base clockwise during systole [20].

In normal systolic function, the LV walls should thicken visibly and move inward symmetrically, coming close to one another during systole. All walls should demonstrate coordinated inward motion and uniform thickening (radial contraction). You should also see the base move toward the apex (longitudinal shortening). Although circumferential shortening contributes to the overall narrowing of the cavity, this is not directly distinguishable on standard PoCUS imaging.


Size and Shape:

The LV should be ellipsoid or bullet-shape. It is typically larger than the right ventricle, assuming the RV is normal, usually about one and a half times the size of the RV.


What is NOT normal

Decreased global function:

LVfx is considered reduced if the LV walls fail to contract effectively toward the center of the cavity during systole. Wall motion will appear sluggish or diminished, and the overall inward movement and thickening will be reduced.


Size and Shape:

Decreased LV systolic function is often accompanied by dilation, such as in dilated cardiomyopathy. The LV loses its normal ellipsoid or bullet shape, appearing globular or rounded, and is much larger than the right ventricle.


RWMAs:

Segmental dysfunction may be observed when one or more LV wall segments move less than expected (hypokinesis), move opposite direction as normal (dyskinetic), or do not move at all (akinesis), while other segments contract normally. These findings often suggest ischemia or myocardial injury. Akinetic segments will also often appear thinner and more hyperechoic than normal myocardium reflecting myocardial fibrosis or scarring that reduce contractility and alter tissue characteristics.


Hyperdynamic function:

In cases of increased contractility, the LV walls may nearly or completely touch during systole, leading to near obliteration of the ventricular cavity. This is often most pronounced at the apex, while the basal segments may not completely obliterate. Hyperdynamic function can occur in states of low preload, hypovolemia, or compensatory hypercontractility. Of note, tachycardia can create the illusion of hyperdynamic function, therefore it is important to look at the wall motion and cavity itself and not just the rate at which the heart is contracting. Saving and slowing down a clip can be helpful in cases of significant tachycardia


Figure 2a. Normal function seen in the A4C view


Figure 2b. Severely decreased function, globally seen in the A4C view


Stepwise Technique

** For detailed instructions on obtaining the cardiac windows, please revisit the prerequisite KidSONO Introduction to Cardiac Windows Module

Stepwise Technique

1.  Parasternal long axis: Visual assessment of LVfx

i. Assess the overall movement of the LV walls

ii. Observe the anterior mitral valve leaflet (AMVL) and evaluate if it approaches the interventricular septum during diastole

iii. M-Mode: Activate M-mode and place the cursor line through the tip of the AMVL and the septum. Measure EPSS


2.  Parasternal Short Axis: Visual assessment of global LVfx & regional wall motion abnormalities 

i. From the MV level sweep the probe all the way to the apex, assessing LVFx and wall motion at each level

– Obtain a representative clip at the mid-papillary level and/or where contractility changes are observed

ii. M-Mode: At the mid-papillary level, place the M-mode curser perpendicularly through the centre of the LV cavity, between the papillary muscles. Calculate fractional shortening


3. Apical 4 Chamber: Visual assessment of global LVfx & size

i. Assess the overall movement of the LV walls

ii. Assess which ventricle is making up the apex of the heart (as should be the LV) and compare general size of RV to LV


4. Subxiphoid 4 Chamber: Visual assessment of global LVfx & size

i. Assess the overall movement of the LV walls


5. Documentation: Store representative clips for each standard view