What am I Looking at?
In the PLAX view, we see the interventricular septum (IVS), LV cavity, and the posterior wall of the LV (Figure 3). You should see the mitral valve, LV outflow tract, and AOV in one continuous plane. Most often, you will not see the distal ventricle/apex in the same window as your AOV/MV.
Foreshortening is a common limitation to the PLAX view, and recognizing when you are foreshortened is important to avoid overestimating systolic function. Signs of foreshortening include a LV cavity that seems unusually short and truncated, rather than elongated (figure 4). Remember to ensure that you have the AMVL as well as the point of coaptation of the AOV cusps clearly visible in the same plane and the ventricle looks elongated an bullet shaped as this will ensure that you are in the true long-axis position and will avoid the risk of foreshortening.
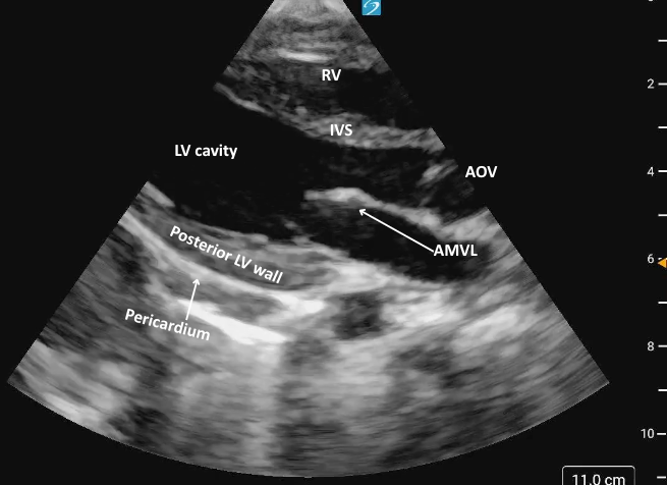 Figure 3: Parasternal long axis view in cardiology convention anatomically labeled.
Figure 4ab: Comparison of PLAX foreshortened (a) VS not foreshortened (b)
What is Normal
Contractility:
The IVS and posterior LV wall should both thicken and move inward toward each other during systole, with coordinated and symmetric motion.
AMVL motion:
When the AMVL nearly contacts the IVS during diastole, it is generally indicative of normal LV systolic function. The closer the leaflet comes to the septum, the better the presumed function.
**Key Consideration: Assessing LV function based on AMVL motion assumes a structurally and functionally normal mitral valve and absence of other pathology such as aortic regurgitation, LV dilation, and IVS motion abnormality/arrythmia. In the presence of such pathology, this method is an unreliable correlate of LV systolic function.
Figure 5: 2D PLAX demonstrating normal contractility and function with minimal distance between the AMVL and IVS during diastole.
What is NOT Normal
Decreased global function:
If the IVS and the posterior LV wall fail to move effectively toward each other during systole it suggests reduced LVfx. Wall motion may appear sluggish, and thickening may be diminished.
AMVL motion
If the AMVL does not move close to the IVS, but rather creates a visibly large gap, this could suggest reduced systolic function (figure 6).
Figure 6: 2D PLAX view demonstrating markedly reduced LV systolic function, evidenced by poor inward motion of the LV walls during systole and a large gap between the IVS and AMVL.
PLAX M-Mode
In the PLAX view, M-mode is commonly used to assess LVfx by placing the cursor perpendicular to the IVS and posterior wall at the level of the MV tips. This provides a time-motion trace of LV wall motion and cavity size throughout the cardiac cycle, with distance displayed on the y-axis and time on the x-axis allowing evaluation of systolic function.
You’ll see a wave-like motion tracing of the MV leaflets movement across the cardiac cycle. In early diastole, the AMVL rapidly opens toward the IVS, creating the tall E-wave, followed by a smaller A-wave from atrial contraction (figure 7,8).
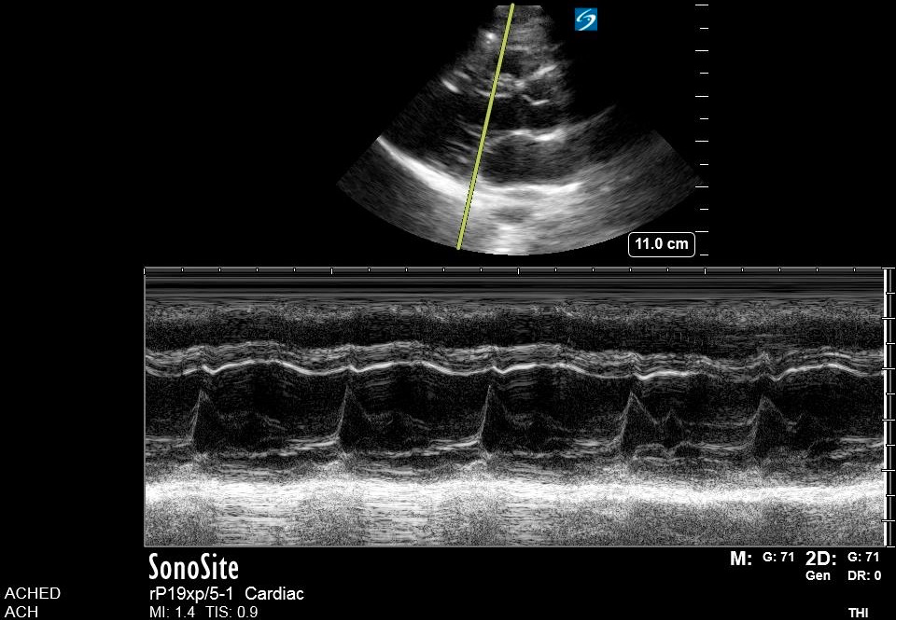 Figure 7. M-mode
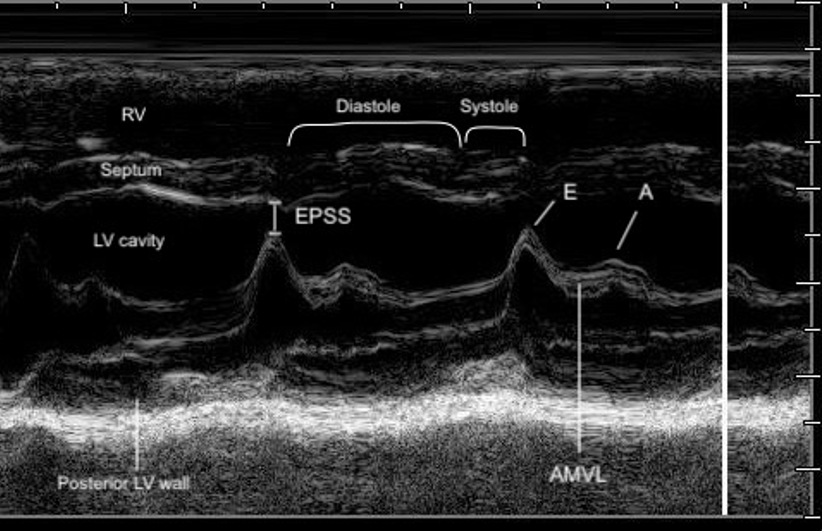 Figure 8. Zoomed-in view of the PLAX M-mode tracing at the level of the mitral valve tips.
End Point Septal Separation
The EPSS is a measure of AMVL motion and is used as a way to semi-quantify LVfx. It refers to the minimal distance between the peak of the E-wave and the IVS at the same X-axis time point (figure 8).
Technique – EPSS
1. Activate M-mode and place the cursor line through the tip of the AMVL and the septum.
2. Measure EPSS if findings appear grossly abnormal, when a semi-quantitative baseline is useful for follow-up or clinical reassessment, or consultation with cardiology is anticipated.
· The EPSS is measured at the minimum distance between the AMVL and the septum in early diastole.
3. Save the M-mode image, and include the measurement if performed.

In a normally functioning LV, the E-point comes close to the septum (figure 9). In pediatric patients, there is limited validated evidence for normal EPSS values. A 1983 study provided guidelines for the use of EPSS in infants and children and found that normal EPSS was ≤ to 6mm, with 7-8mm being tail end of normal [21]. This was confirmed in a more recent study where an EPSS of 6.17 mm optimally distinguished normal from depressed LV systolic function, with a sensitivity of 86% and specificity of 92% [12].
The larger the EPSS distance the worse the function. Similar to the AMVL visual assessment, if the E-point is not close to the IVS during the M-mode tracing, this could suggest reduced systolic function. Specific cutoff values are available to guide interpretation (table 3) (Figure 10).
Table 2: EPSS value ranges for pediatric populations [12,21]
| ≤7mm | Normal |
| ≥ 8 | Reduced function |
Key Consideration: The EPSS should never be used as a single measure of LV systolic function as it can be influenced by many factors such as valvular dysfunction in mitral stenosis or aortic insufficiency. EPSS should always be considered in a larger evaluation of LV function including visual assessment of LV contractility. EPSS alone is insufficient to guide decisions regarding cardiology referral or formal echocardiography without corroborating functional findings.
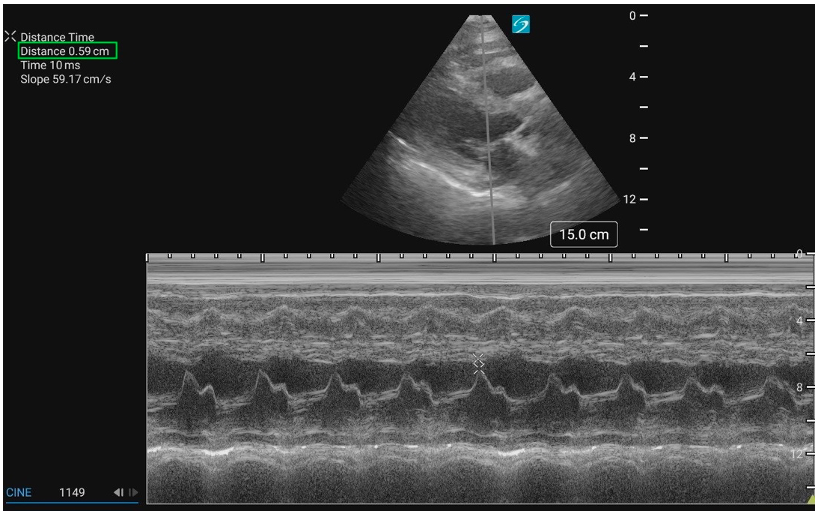 Figure 9: PLAX M-mode with normal EPSS measurement
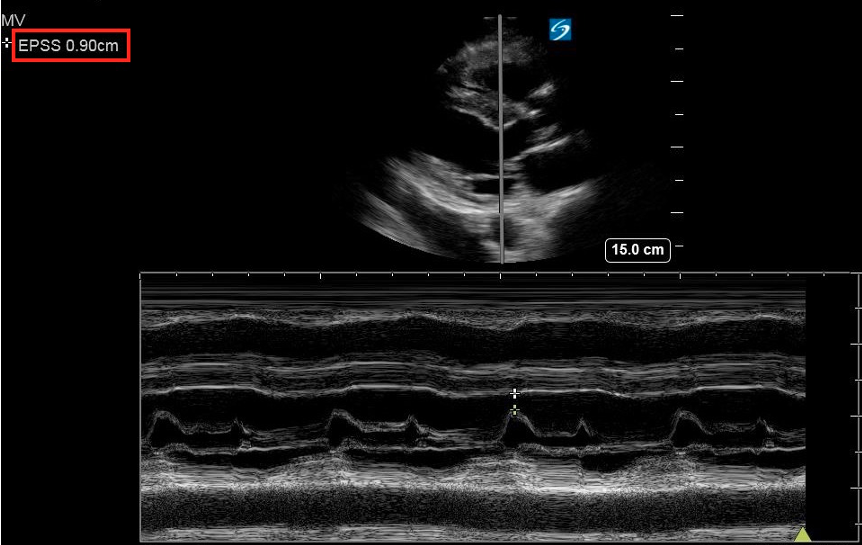 Figure 10: PLAX M-mode abnormal EPSS